Nature ( 2026 ) Cite this article
Intricacies of TGF-β signaling in Treg and Th17 cell biology
A CD25-biased interleukin-2 for autoimmune therapy engineered via a semi-synthetic organism
Expression of an interleukin-2 partial agonist enhances regulatory T cell persistence and efficacy in mouse autoimmune models
In vivo pT reg cell generation has gained attention because pT reg cells enforce tolerance to diverse non-self antigens, including commensal microbiota, dietary components, allergens, neoantigens and certain pathogens, making their induction therapeutically promising 12 , 20 .
However, this remains challenging because inflammatory cues promote pro-inflammatory CD4 + T cell differentiation while impairing pT reg cell commitment and stability 21 , 22 .
Moreover, leveraging TGFβ in vivo remains impractical owing to its pleiotropy (fibrosis and tumour promotion) and unfavourable pharmacokinetic properties 23 , unlike IL-2, which has been engineered to preferentially target T reg cells 24 , 25 .
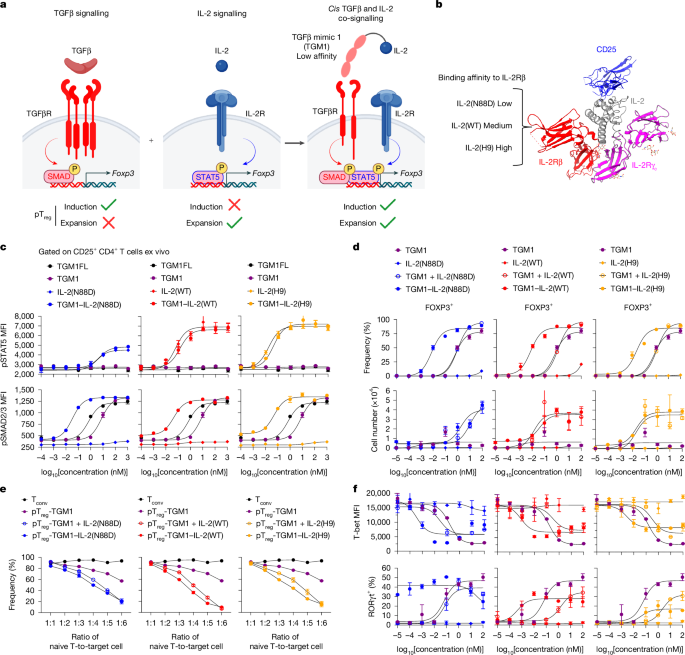
To address these challenges, we designed a bi-specific molecule that induces IL-2 and TGFβ signals in cis to the same cell by conjugating a low-affinity TGFβ mimic agonist that largely bypasses other cell types, to IL-2, which acts as both a targeting arm and a STAT5 activator.
This molecule selectively and simultaneously activates both pathways on IL-2 receptor (IL-2R)-expressing T cells, enabling localized and cell-specific induction of pT reg cells while minimizing off-target effects.
In vivo, it converted up to 80% of ovalbumin (OVA)-specific OT-II and myelin oligodendrocyte glycoprotein (MOG) 35–55 -specific 2D2 CD4 + T cells into FOXP3 + pT reg cells in secondary lymphoid organs after intraperitoneal administration of OVA and MOG 35–55 , respectively.
The induced pT reg cells are highly functional and stable, exhibit high RORγt expression, establish tolerance that protect against allergic and neuroautoimmune inflammation, and attenuate intestinal inflammation.
These findings highlight an antigen-specific pT reg cell induction strategy with therapeutic potential across diverse immune diseases.
Design and characterization of TGM1–IL-2
Our design goal was to activate simultaneous STAT5 and SMAD2/3 signalling in IL-2R-expressing cells.
We therefore fused IL-2 to a low-affinity version of TGFβ that is largely functionally inactive on cells that express TGFβ receptor (TGFβR) alone: the fusion protein preferentially acts on IL-2R-expressing T cells, giving the molecule AND-gated activity to activate both pSTAT5 and SMAD2/3 pathways (Fig.
1a ).
We were inspired by a helminth-derived TGFβ mimic, termed TGFβ mimic 1 (TGM1), that activates TGFβR–SMAD2/3 signalling 7 , 26 , 27 .
TGM1 is an immunoglobulin-domain protein 27 that is structurally distinct from mammalian TGFβ (which is a Cys-knot fold 28 ), and has ideal drug-like properties.
Full-length TGM1 (TGM1FL) comprises five domains: domains 1–3 bind TGFβR with low affinity, whereas domains 4 and 5 engage the co-receptor CD44 with high affinity 26 , 27 .
To generate an IL-2–TGFβ surrogate co-agonist, we fused the low-affinity TGFβ agonist domains 1–3 of TGM1 (referred to hereafter as TGM1) to IL-2 via a flexible GSG linker and added mouse serum albumin (MSA) to improve in vivo half-life (Fig.
1a and Extended Data Fig.
1a ).
We tested three IL-2 variants: wild-type IL-2 (IL-2(WT)), IL-2(N88D) and IL-2(H9) (Fig.
1b ).
Relative to IL-2(WT), IL-2(N88D) has reduced affinity for the IL-2 receptor β chain (IL-2Rβ), thereby preferentially stimulating T reg cells with high CD25 expression 24 , whereas IL-2(H9) displays enhanced IL-2Rβ affinity and more efficiently activates IL-2Rβ-expressing immune cells 29 (Fig.
1b ).
Incorporation of low-affinity TGM1 enables the fusion proteins to co-activate SMAD2/3 signalling in IL-2R-expressing cells while providing tunable STAT5 activation potency.
These molecules displayed ideal biochemical properties and high expression levels in Expi293 cells, and purified by size-exclusion chromatography as monodisperse proteins (Extended Data Fig.
1b and Supplementary Fig.
1 ).
Signalling assays in primary mouse CD4 + T cells demonstrated that TGM1–IL-2 induced phosphorylated STAT5 (pSTAT5) in CD25 + cells at levels resembling those induced by the respective IL-2 counterparts, with the N88D variant exhibiting a reduced maximal response (Fig.
1c ).
Notably, TGM1–IL-2 markedly enhanced SMAD2/3 activation, shifting the phosphorylated SMAD2/3 (pSMAD2/3) dose–response curve leftward by approximately 2.5 logs compared with low-affinity TGM1 alone (Fig.
1c ), reflecting increased apparent TGFβR-binding affinity driven by IL-2–IL-2R engagement.
Additionally, pSTAT5 and pSMAD2/3 responses were reduced in CD25 − CD4 + T cells and CD8 + T cells (Extended Data Fig.
1c,d ), consistent with their low CD25 expression.
Moreover, truncation of any of the three domains in TGM1 abolished pSMAD2/3 activation (Extended Data Fig.
1e ).
These results show that TGM1–IL-2 preserves IL-2 signalling while robustly inducing pSMAD2/3 in CD25 + CD4 + T cells.
Next, in vitro pT reg cell differentiation assays using mouse naive CD4 + T cells activated with anti-CD3 and anti-CD28 antibodies showed that TGM1–IL-2 markedly enhanced FOXP3 + pT reg cell generation, shifting the FOXP3 + dose–response curve leftward by about 2 logs compared with either low-affinity TGM1 alone or the combination of TGM1 and IL-2 (Fig.
1d ).
TGM1–IL-2 also produced pT reg cell numbers resembling the combined TGM1 and IL-2 treatment, although TGM1–IL-2(N88D) generated fewer pT reg cells than the other two variants (Fig.
1d ).
Truncation of any TGM1 domain reduced pT reg cell induction (Extended Data Fig.
1f ).
Consistently, TGM1–IL-2 more efficiently converted mouse CD44 + FOXP3 − CD4 + conventional T cells (T conv cells) and human peripheral blood mononuclear cell (PBMC) CD4 + T cells into pT reg cells (Extended Data Fig.
1g,h ).
In vitro suppression assays showed that mouse pT reg cells generated with TGM1–IL-2 potently suppressed naive T cell proliferation and activation, as evidenced by reduced CellTrace Violet (CTV) dilution and decreased CD25 expression (Fig.
1e and Extended Data Fig.
1i ).
These findings demonstrate that TGM1–IL-2 efficiently drives highly functional pT reg cell induction in vitro.
TGM1–IL-2 also potently suppressed mouse CD4 + T cell activation and effector differentiation in vitro, as shown by left-shifted inhibitory dose–response curves for T-bet, CD25 and CD69 expression and for IFNγ and TNF production compared with either TGM1 alone or the combination of TGM1 and IL-2 (Fig.
1f and Extended Data Fig.
2a,b ).
TGM1–IL-2 did not induce IL-17A production and, particularly for the wild-type and H9 variants, dampened RORγt induction at high concentrations; it also exerted concentration-dependent effects on CD62L expression (Fig.
1f and Extended Data Fig.
2b,c ).
Notably, TGM1–IL-2 maintained CD4 + T cell numbers resembling the TGM1 plus IL-2 combination (Extended Data Fig.
2d ).
In vivo effects of surrogate agonists
Next, we assessed the in vivo tolerability of TGM1–IL-2 and its effects on IL-2R-expressing cells in mice under steady-state conditions (Extended Data Fig.
3a ).
A 50 pmol dose of TGM1–IL-2 variants or IL-2(N88D) did not notably affect body weight, whereas TGM1, IL-2(WT) and IL-2(H9) caused mild weight loss (Extended Data Fig.
3b,c ).
TGM1–IL-2 also did not induce appreciable splenomegaly, in contrast to IL-2, which drove marked splenomegaly with spleen volumes positively correlated with IL-2Rβ-binding affinity (Extended Data Fig.
3d,e ).
Quantification of splenic immune populations showed that IL-2(N88D) efficiently expanded FOXP3 + T reg cells in vivo, reflected by a marked increase in the ratios of T reg cells to CD4 + T cells, CD8 + T cells and natural killer (NK) cells, as well as increased numbers, accompanied by an increased fraction of Ki-67 + proliferating T reg cells among total CD4 + T cells and within the T reg cell compartment, whereas TGM1–IL-2(N88D) did not (Extended Data Fig.
3f–h ).
By contrast, IL-2(WT), and particularly IL-2(H9), increased splenic CD8 + T cell and NK cell numbers, as well as the proportions of Ki-67 + proliferating and IFNγ-producing cells, whereas the corresponding TGM1–IL-2 showed markedly attenuated effects (Extended Data Fig.
3i–k ).
Moreover, all three IL-2 variants robustly promoted T reg cell activation and function, as indicated by elevated expression of activation markers (CD25, ICOS and GITR) and functional molecules (CTLA4 and IL-10) relative to PBS controls, whereas TGM1–IL-2 did not (Extended Data Fig.
4a,b ).
Under steady-state conditions, most splenic T reg cells were Helios + RORγt − , consistent with a predominance of tT reg cells, and IL-2 further increased Helios + cell proportions whereas TGM1–IL-2 did not (Extended Data Fig.
4c ).
Both IL-2 and TGM1–IL-2 had minimal effects on CD62L expression (Extended Data Fig.
4d ).
These findings demonstrate that TGM1 fusion potently antagonizes IL-2–driven expansion and activation of T reg cells and other IL-2R + T and NK cells under steady-state conditions (Extended Data Fig.
4e ).
Surrogate agonists induce pT reg cells in OVA-immunized mice
Next, we evaluated the capacity of TGM1–IL-2 to induce antigen-specific pT reg cells in an OVA activation model.
First, in vitro OT-II pT reg cell differentiation assays stimulated with OVA peptide showed that TGM1–IL-2, particularly the wild-type variant, strongly promoted FOXP3 + pT reg cell differentiation at low concentrations, increasing both percentage and numbers of cells (Extended Data Fig.
5a ).
Furthermore, in in vivo pT reg cell induction assays in which mice received donor naive OT-II cells and repeated intraperitoneal OVA protein (Fig.
2a ), analysis on day 11 showed that all three TGM1–IL-2 variants, particularly the IL-2(WT) fusion, drove robust FOXP3 + OT-II pT reg cell induction, reaching up to about 80% in the mesenteric lymph node (mLN), inguinal lymph node (ILN), and spleen, notably yielding a high proportion of RORγt + pT reg cells (Fig.
2b,c ).
By contrast, low-affinity TGM1 induced only about 10% FOXP3 + cells, and PBS, IL-2(WT) and IL-2(H9) had minimal effects (Fig.
2b,c ).
Although IL-2(N88D) generated a substantial FOXP3 + population, these cells were predominantly Helios + RORγt − (Fig.
2b,c and Extended Data Fig.
5b ), probably reflecting expansion of contaminating OT-II tT reg cells present in the naive donors.
Similarly, TGM1–IL-2 substantially increased the FOXP3 + T reg cell fraction among endogenous OVA-specific CD4 + T cells in lymph nodes (Extended Data Fig.
5c ).
Moreover, TGM1–IL-2, especially the wild-type and H9 variants, notably increased OT-II cell numbers and Ki-67 + cell fractions relative to PBS controls, whereas IL-2 did not, possibly owing to suppression by expanded tT reg cells or nutrient competition with other expanded IL-2R + cells (Extended Data Fig.
5d,e ).
Consequently, TGM1–IL-2, particularly TGM1–IL-2(WT), yielded substantial numbers of total and RORγt + OT-II pT reg cells (Fig.
2d ).
These results demonstrate that TGM1–IL-2, especially the wild-type fusion, potently promotes antigen-specific pT reg cell development in peripheral lymphoid organs of OVA-immunized mice (Extended Data Fig.
4e ).
Fig.
2: Effect of IL-2–TGFβ co-agonists on antigen-specific pT reg cell induction and phenotype in OVA-immunized mice.
a , Schematic illustration of OVA and protein administration.
Created in BioRender; Sun, Q.
https://BioRender.com/xfy9d60 (2026).
IP, intraperitoneal; IV, intravenous.
b – d , Representative flow cytometry plots ( b ) and quantification of FOXP3 + and RORγt + FOXP3 + OT-II cell frequencies ( c ) and absolute cell numbers ( d ) in the indicated lymphoid organs (mLN, n = 16 samples; ILN, n = 20 samples; spleen (SPL), n = 6 samples).
e , Representative flow cytometry plots and quantification of FOXP3 + and RORγt + FOXP3 + OT-II cell frequencies in the indicated lymphoid organs ( n = 4 mice per group).
f , Histogram showing the distribution of distinct subsets (a–h; colour code used in the rest of the figure) among donor OT-II cells in the lymph nodes.
g , Quantification of IFNγ + and IL-17A + OT-II cell frequencies in the lymph nodes ( n = 16 samples per group).
h , Representative flow cytometry plots and quantification of CD103 + FOXP3 + and IL-10 + FOXP3 + OT-II cell frequencies in the lymph nodes ( n = 16 samples per group).
i , Representative flow cytometry plots showing expression of the indicated molecules in the indicated CD4 + T cell subsets from lymph nodes.
Data are presented as mean ± s.e.m.
Data in b – d , f are pooled from two independent experiments.
Data in e , g – i are representative of two independent experiments.
Statistics were obtained by one-way ANOVA coupled with Dunnett’s multiple-comparisons test ( c , d , g , h ) or unpaired Welch’s t -test (two-tailed) ( e ).
* P < 0.05, ** P < 0.01, *** P < 0.001, **** P < 0.0001; NS, not significant ( P ≥ 0.05).
Source Data Full size image
a , Schematic illustration of OVA and protein administration.
Created in BioRender; Sun, Q.
https://BioRender.com/xfy9d60 (2026).
IP, intraperitoneal; IV, intravenous.
b – d , Representative flow cytometry plots ( b ) and quantification of FOXP3 + and RORγt + FOXP3 + OT-II cell frequencies ( c ) and absolute cell numbers ( d ) in the indicated lymphoid organs (mLN, n = 16 samples; ILN, n = 20 samples; spleen (SPL), n = 6 samples).
e , Representative flow cytometry plots and quantification of FOXP3 + and RORγt + FOXP3 + OT-II cell frequencies in the indicated lymphoid organs ( n = 4 mice per group).
f , Histogram showing the distribution of distinct subsets (a–h; colour code used in the rest of the figure) among donor OT-II cells in the lymph nodes.
g , Quantification of IFNγ + and IL-17A + OT-II cell frequencies in the lymph nodes ( n = 16 samples per group).
h , Representative flow cytometry plots and quantification of CD103 + FOXP3 + and IL-10 + FOXP3 + OT-II cell frequencies in the lymph nodes ( n = 16 samples per group).
i , Representative flow cytometry plots showing expression of the indicated molecules in the indicated CD4 + T cell subsets from lymph nodes.
Data are presented as mean ± s.e.m.
Data in b – d , f are pooled from two independent experiments.
Data in e , g – i are representative of two independent experiments.
Statistics were obtained by one-way ANOVA coupled with Dunnett’s multiple-comparisons test ( c , d , g , h ) or unpaired Welch’s t -test (two-tailed) ( e ).
* P < 0.05, ** P < 0.01, *** P < 0.001, **** P < 0.0001; NS, not significant ( P ≥ 0.05).
We used FTY720 to test whether RORγt + OT-II pT reg cells induced by TGM1–IL-2(WT) can differentiate locally in distinct lymphoid organs; efficacy was confirmed by a marked reduction in blood CD4 + T cells (Extended Data Fig.
5f,g ).
In FTY720-treated mice, substantial FOXP3 + OT-II pT reg cells co-expressing CD25 and RORγt were present on day 11 in the mLN, ILN and spleen, with frequencies similar to those in PBS controls (Fig.
2e and Extended Data Fig.
5h,i ).
By contrast, only a small FOXP3 + fraction was detected in the mLN and ILN on day 5, whereas the spleen contained a high FOXP3 + frequency with low RORγt expression, indicating that RORγt + pT reg cells were primarily induced between days 5 and 11 (Fig.
2e ).
FTY720 also markedly reduced both total and pT reg OT-II cells in the spleen, but not in the mLN and ILN, on day 11 (Extended Data Fig.
5j,k ), consistent with blocking egress from lymph nodes but not spleen.
These data indicate that RORγt + OT-II pT reg cells can differentiate independently in the ILN, mLN and spleen.
After OT-II pT reg cell induction by TGM1–IL-2(WT) followed by OVA-supplemented drinking water to promote gut homing, we detected substantial populations of RORγt + OT-II pT reg cells with low GATA3 expression in Peyer’s patches, small intestine and colon, demonstrated by both frequencies and numbers (Extended Data Fig.
6a–d ).
Low-affinity TGM1 increased proportions of CD4 + follicular helper T cells (T FH cells; FOXP3 − PD-1 + BCL6 + ) relative to PBS, whereas TGM1–IL-2 slightly reduced this population (Fig.
2f and Extended Data Fig.
6e ).
IL-2(N88D) and TGM1–IL-2(H9) notably increased type 2 helper CD4 + T cell (T H 2 cell; FOXP3 − GATA3 + ) frequencies, whereas TGM1–IL-2(N88D) and TGM1–IL-2(WT) did not (Fig.
2f ).
Low-affinity TGM1 also substantially increased IL-17A-producing and FOXP3 − RORγt + CD4 + type 17 helper T cell (T H 17 cell) percentages, whereas TGM1–IL-2 only modestly increased IL-17A + cell proportions (Fig.
2f,g and Extended Data Fig.
6f ).
By contrast, IL-2 increased IFNγ- and TNF-producing cell frequencies, whereas TGM1–IL-2 strongly reduced them (Fig.
2g and Extended Data Fig.
6f,g ).
These results indicate that TGM1–IL-2 suppresses CD4 + type 1 helper T cell (T H 1 cell) and T FH cell development while modestly enhancing T H 17 differentiation in OVA-immunized mice.
OT-II pT reg cells induced by TGM1–IL-2, particularly the wild-type and H9 variants, contained a large fraction of CD103 + and IL-10-producing cells and exhibited increased expression of activation markers (CD25, ICOS, CD69 and GITR), suppressive molecules (CTLA4, CD39, TIGIT and CD73) and the chemokine receptor CXCR3, exceeding levels in endogenous T reg cells (Fig.
2h,i and Extended Data Fig.
6h,i ).
By contrast, they expressed modest to low levels of NRP1 and CD62L (Extended Data Fig.
6h,i ).
These findings demonstrate that TGM1–IL-2 induces highly activated, functionally potent pT reg cells in vivo.
Surrogate co-agonist establishes allergic tolerance
We next tested whether TGM1–IL-2–induced pT reg cells confer in vivo tolerance in an OVA-induced type 2 airway inflammation model, in which mice were sensitized with aluminium-adjuvanted OVA and then re-challenged intranasally with OVA after OT-II pT reg cell induction (Fig.
3a ).
TGM1–IL-2(WT) pretreatment markedly protected against allergic airway inflammation compared with PBS, as evidenced by lower lung inflammation scores, reduced serum total IgE and OVA-specific IgE/IgG1, and decreased infiltration of CD45.2 + immune cells (including CD11b + myeloid cells and CD3 + T cells) in lung and bronchoalveolar lavage fluid (BALF), with a pronounced reduction in eosinophil frequency and numbers, whereas IL-2(WT) or low-affinity TGM1 provided no meaningful benefit (Fig.
3b–g and Extended Data Fig.
7a,b ).
Moreover, in TGM1–IL-2(WT)–treated mice, up to 80% of OT-II cells in the lung, lung-draining lymph nodes (LDLNs) and spleen persisted as FOXP3 + pT reg cells, with high absolute numbers (Fig.
3h–k and Extended Data Fig.
7c ).
Lung-infiltrating OT-II pT reg cells were predominantly GATA3 + RORγt − , whereas those in LDLN and spleen were mainly GATA3 − RORγt + (Fig.
3h–j and Extended Data Fig.
7c ).
LDLNs also contained abundant CD25 + and IL-10 + OT-II pT reg cells with high expression of ICOS, CD103 and CD39 (Extended Data Fig.
7d,e ).
By contrast, mice treated with PBS, IL-2(WT) or low-affinity TGM1 showed few FOXP3 + OT-II pT reg cells, and IL-2(WT) instead increased GATA3 + FOXP3 − T H 2 OT-II cell frequency (Fig.
3h–k and Extended Data Fig.
7c,f ).
Fig.
3: IL-2–TGFβ co-agonists establish immune tolerance to suppress OVA-induced allergic inflammation.
a – k , Therapeutic effect of TGM1–IL-2 in establishing tolerance to suppress OVA-induced airway inflammation (mock, n = 4 mice; treatment groups, n = 7 mice per group).
a , Schematic illustration.
IN, intranasal.
Created in BioRender; Sun, Q.
https://BioRender.com/kk38324 (2026).
b , c , Representative lung histology ( b ) and quantification of inflammation scores ( c ).
Scale bars, 1 mm.
d , Quantification of serum OVA-specific IgE and IgG1 levels.
e – g , Representative flow cytometry plots ( e ) and quantification of CD11c − SIGLECF + eosinophil frequencies ( f ) and absolute numbers ( g ) among CD45.2 + CD11b + cells.
h – j , Representative flow cytometry plots ( h ) and quantification of FOXP3 + , GATA3 + FOXP3 + and RORγt + FOXP3 + OT-II cell frequencies in lung ( i ) and LDLN ( j ).
k , Quantification of FOXP3 + OT-II cell absolute numbers.
l – n , Therapeutic effect of TGM1–IL-2 in establishing tolerance to suppress OVA-induced food allergy (PBS, n = 7 mice; TGM1–IL-2, n = 6 mice).
l , Schematic illustration.
IG, intragastric.
Created in BioRender; Sun, Q.
https://BioRender.com/5n5ru32 (2026).
m , Quantification of mean rectal temperature.
n , Quantification of serum OVA-specific IgE and IgG1 levels.
o – q , OT-II cell phenotypes (PBS, n = 5 mice; TGM1–IL-2, n = 6 mice).
o , p , Representative flow cytometry plots ( o ) and quantification ( p ) of FOXP3 + , GATA3 + FOXP3 + and RORγt + FOXP3 + OT-II cell frequencies.
PP, Peyer’s patches; SI, small intestine.
q , Quantification of FOXP3 + OT-II cell absolute numbers.
Data are presented as mean ± s.e.m.
Data in a – q are representative of two independent experiments.
Statistics were obtained by one-way ANOVA coupled with Dunnett’s multiple-comparisons test ( c , d , f , g , i – k ), two-way ANOVA coupled with Šídák’s multiple-comparisons test ( m ) or unpaired Welch’s t -test (two-tailed) ( n , p , q ).
Source Data Full size image
a – k , Therapeutic effect of TGM1–IL-2 in establishing tolerance to suppress OVA-induced airway inflammation (mock, n = 4 mice; treatment groups, n = 7 mice per group).
a , Schematic illustration.
IN, intranasal.
Created in BioRender; Sun, Q.
https://BioRender.com/kk38324 (2026).
b , c , Representative lung histology ( b ) and quantification of inflammation scores ( c ).
Scale bars, 1 mm.
d , Quantification of serum OVA-specific IgE and IgG1 levels.
e – g , Representative flow cytometry plots ( e ) and quantification of CD11c − SIGLECF + eosinophil frequencies ( f ) and absolute numbers ( g ) among CD45.2 + CD11b + cells.
h – j , Representative flow cytometry plots ( h ) and quantification of FOXP3 + , GATA3 + FOXP3 + and RORγt + FOXP3 + OT-II cell frequencies in lung ( i ) and LDLN ( j ).
k , Quantification of FOXP3 + OT-II cell absolute numbers.
l – n , Therapeutic effect of TGM1–IL-2 in establishing tolerance to suppress OVA-induced food allergy (PBS, n = 7 mice; TGM1–IL-2, n = 6 mice).
l , Schematic illustration.
IG, intragastric.
Created in BioRender; Sun, Q.
https://BioRender.com/5n5ru32 (2026).
m , Quantification of mean rectal temperature.
n , Quantification of serum OVA-specific IgE and IgG1 levels.
o – q , OT-II cell phenotypes (PBS, n = 5 mice; TGM1–IL-2, n = 6 mice).
o , p , Representative flow cytometry plots ( o ) and quantification ( p ) of FOXP3 + , GATA3 + FOXP3 + and RORγt + FOXP3 + OT-II cell frequencies.
PP, Peyer’s patches; SI, small intestine.
q , Quantification of FOXP3 + OT-II cell absolute numbers.
Data are presented as mean ± s.e.m.
Data in a – q are representative of two independent experiments.
Statistics were obtained by one-way ANOVA coupled with Dunnett’s multiple-comparisons test ( c , d , f , g , i – k ), two-way ANOVA coupled with Šídák’s multiple-comparisons test ( m ) or unpaired Welch’s t -test (two-tailed) ( n , p , q ).
We further evaluated whether TGM1–IL-2 induced tolerance to ameliorate OVA-induced food allergy by sensitizing mice with OVA and cholera toxin after OT-II pT reg cell induction (Fig.
3l ).
Compared with PBS controls, TGM1–IL-2(WT) pretreatment led to smaller decreases in rectal temperature and reduced serum OVA-specific IgE and IgG1, indicating attenuated allergic responses (Fig.
3m,n ).
Notably, in mice pre-treated with TGM1–IL-2(WT), a large proportion of OT-II cells in the mLN, Peyer’s patches and small intestine persisted as FOXP3 + pT reg cells, predominantly RORγt + in both frequency and absolute number, whereas few OT-II pT reg cells were detected in PBS controls (Fig.
3o–q ).
These findings demonstrate that TGM1–IL-2 establishes tolerance that suppresses OVA-induced airway inflammation and food allergy, probably by generating stable, functional pT reg cells.
Surrogate co-agonist suppresses neuroinflammation
We next evaluated TGM1–IL-2 in the MOG 35–55 -induced experimental autoimmune encephalomyelitis (EAE) model of neuroinflammation (Fig.
4a ).
TGM1–IL-2(WT) robustly drove donor MOG 35–55 -reactive CD44 + Ki-67 + 2D2 cells to differentiate to FOXP3 + pT reg cells in mLNs, ILNs and spleens, with a substantial fraction expressing RORγt + , as indicated by both frequencies and numbers, whereas PBS, IL-2(WT) or TGM1 induced few pT reg cells (Fig.
4b,c and Extended Data Fig.
8a ).
These 2D2 pT reg cells also upregulated activation and functional markers (CD25, ICOS, CTLA4, CD39, CD103 and IL-10) (Extended Data Fig.
8b ), indicating that TGM1–IL-2 robustly induces functional 2D2 pT reg cells in peripheral lymphoid organs of MOG 35–55 -immunized mice.
Fig.
4: IL-2–TGFβ co-agonists establish immune tolerance to suppress MOG-induced EAE.
a , Schematic illustration of MOG 35–55 and protein administration.
Created in BioRender; Sun, Q.
https://BioRender.com/j3crwdr (2026).
b , c , Representative flow cytometry plots ( b ) and quantification of FOXP3 + and RORγt + FOXP3 + cell frequencies ( b ) and absolute numbers ( c ) among donor CD44 + Ki-67 + 2D2 cells in the indicated lymphoid organs ( n = 8 samples per group).
d – h , Therapeutic effect of TGM1–IL-2 in establishing tolerance to suppress MOG 35–55 -induced EAE ( n = 11 mice per group).
d , Schematic illustration.
CNS, central nervous system; PTX, pertussis toxin; SC, spinal cord; CFA, complete Freund’s adjuvant.
Created in BioRender; Sun, Q.
https://BioRender.com/t3trkm2 (2026).
e , Quantification of mean EAE scores.
f , Quantification of CD4 + T cell absolute numbers in the spinal cord.
g , Quantification of IFNγ- and IL-17A-producing CD4 + T cell numbers in the spinal cord.
h , Representative flow cytometry plots and quantification of GM-CSF + CD4 + T cell frequencies and absolute numbers in the spinal cord.
Data are presented as mean ± s.e.m.
Data in b , c are pooled from two independent experiments.
Data in d – h are representative of two independent experiments.
Statistics were obtained by one-way ANOVA coupled with Dunnett’s multiple-comparisons test ( b , c ), two-way ANOVA coupled with Šídák’s multiple-comparisons test ( e ) or unpaired Welch’s t -test (two-tailed) ( f – h ).
Source Data Full size image
a , Schematic illustration of MOG 35–55 and protein administration.
Created in BioRender; Sun, Q.
https://BioRender.com/j3crwdr (2026).
b , c , Representative flow cytometry plots ( b ) and quantification of FOXP3 + and RORγt + FOXP3 + cell frequencies ( b ) and absolute numbers ( c ) among donor CD44 + Ki-67 + 2D2 cells in the indicated lymphoid organs ( n = 8 samples per group).
d – h , Therapeutic effect of TGM1–IL-2 in establishing tolerance to suppress MOG 35–55 -induced EAE ( n = 11 mice per group).
d , Schematic illustration.
CNS, central nervous system; PTX, pertussis toxin; SC, spinal cord; CFA, complete Freund’s adjuvant.
Created in BioRender; Sun, Q.
https://BioRender.com/t3trkm2 (2026).
e , Quantification of mean EAE scores.
f , Quantification of CD4 + T cell absolute numbers in the spinal cord.
g , Quantification of IFNγ- and IL-17A-producing CD4 + T cell numbers in the spinal cord.
h , Representative flow cytometry plots and quantification of GM-CSF + CD4 + T cell frequencies and absolute numbers in the spinal cord.
Data are presented as mean ± s.e.m.
Data in b , c are pooled from two independent experiments.
Data in d – h are representative of two independent experiments.
Statistics were obtained by one-way ANOVA coupled with Dunnett’s multiple-comparisons test ( b , c ), two-way ANOVA coupled with Šídák’s multiple-comparisons test ( e ) or unpaired Welch’s t -test (two-tailed) ( f – h ).
Mice pretreated with TGM1–IL-2(WT) showed markedly reduced EAE clinical scores after rechallenging with MOG 35–55 emulsified in complete Freund’s adjuvant (9 out of 11 remained EAE-free), whereas nearly all control mice developed disease (Fig.
4d,e , and Extended Data Fig.
8c ).
TGM1–IL-2(WT) markedly reduced CD45.2 + immune infiltration in the spinal cord, including CD11b + CD3 − myeloid cells, CD11b − CD3 + T cells and CD4 + T cells, and also decreased IFNγ- and IL-17A-producing CD4 + T cell numbers (despite similar frequencies) (Fig.
4f,g , and Extended Data Fig.
8d, e ).
Moreover, TGM1–IL-2(WT) reduced GM-CSF-producing CD4 + T cell percentage and numbers, indicating a decrease in pathogenic T H 17 cells (Fig.
4h ).
These results demonstrate that TGM1–IL-2 establishes tolerance that protects mice from EAE.
Role of IL-2 in pT reg cell induction and tolerance
To investigate the contribution of IL-2 signalling in TGM1–IL-2, we generated TGM1–IL-2(DN) by fusing TGM1 to the IL-2 mutant H9-RETR, which increases IL-2Rβ affinity but abolishes common γ-chain binding and thus IL-2R signalling 30 (Fig.
5a , Extended Data Fig.
9a and Supplementary Fig.
1 ).
As expected, similar to IL-2(DN), TGM1–IL-2(DN) did not induce pSTAT5, but it triggered pSMAD2/3 with a dose–response curve resembling that of TGM1–IL-2(WT) (Fig.
5b ).
In vitro, TGM1–IL-2(DN) induced FOXP3 + pT reg cells in a dose-dependent manner similar to TGM1–IL-2(WT), but markedly reduced total CD4 + T cell and pT reg cell numbers and suppressed CD25 and T-bet expression and IFNγ production in CD4 + T cells (Fig.
5c and Extended Data Fig.
9b–d ).
In suppression assays, pT reg cells generated with TGM1–IL-2(DN) (or TGM1 + IL-2(DN)) were less suppressive than those induced by TGM1–IL-2(WT) (or TGM1 + IL-2(WT)), as shown by reduced inhibition of T conv cell proliferation (CTV dilution) and higher CD25 expression (Fig.
5d and Extended Data Fig.
9e ).
These results suggest that IL-2 signalling activated by TGM1–IL-2 is critical for optimal expansion and suppressive function of induced pT reg cells in vitro.
Fig.
5: IL-2–TGFβ co-agonists activate IL-2 signalling to enable optimal pT reg cell development and immune tolerance .
a , Schematic illustration of TGM1–IL-2(DN).
Created in BioRender; Sun, Q.
https://BioRender.com/enpd8hs (2026).
b , Ex vivo dose–response curves of pSTAT5 and pSMAD2/3 in primary CD25 + CD4 + T cells ( n = 2 biological replicates).
c , In vitro dose–response curves for FOXP3 + cell frequency and number in cultured mouse naive CD4 + T cells ( n = 2 biological replicates).
d , CTV dilution of naive T cells co-cultured in vitro with the indicated cells ( n = 2 biological replicates).
e – g , Quantification and phenotypic analysis of OT-II pT reg cells in the lymph nodes ( n = 16 samples per group).
e , Representative flow cytometry plots and quantification of FOXP3 + and RORγt + FOXP3 + OT-II cell frequencies and absolute numbers.
f , Representative flow cytometry plots and quantification of CD103 + FOXP3 + and IL-10 + FOXP3 + OT-II cell frequencies.
g , Representative flow cytometry plots and quantification showing expression of the indicated molecules on OT-II pT reg cells.
h – k , Therapeutic effect of TGM1–IL-2 in OVA-induced airway inflammation model (mock, n = 4 mice; PBS, n = 6 mice; TGM1–IL-2(WT), n = 7 mice; TGM1–IL-2(DN), n = 6 mice).
h , Representative lung histology and quantification of inflammation scores.
Scale bars, 1 mm.
i , Quantification of serum levels of OVA-specific IgE and IgG1.
j , k , Representative flow cytometry plots ( j ) and quantification of CD11c − SIGLECF + eosinophil frequencies ( j ) and absolute numbers ( k ) among CD45.2 + CD11b + cells in the indicated tissues.
Data are presented as mean ± s.e.m.
Data in b – k are representative of two independent experiments.
Statistics were obtained by one-way ANOVA coupled with Tukey’s multiple-comparisons test ( e – k ).
Source Data Full size image
a , Schematic illustration of TGM1–IL-2(DN).
Created in BioRender; Sun, Q.
https://BioRender.com/enpd8hs (2026).
b , Ex vivo dose–response curves of pSTAT5 and pSMAD2/3 in primary CD25 + CD4 + T cells ( n = 2 biological replicates).
c , In vitro dose–response curves for FOXP3 + cell frequency and number in cultured mouse naive CD4 + T cells ( n = 2 biological replicates).
d , CTV dilution of naive T cells co-cultured in vitro with the indicated cells ( n = 2 biological replicates).
e – g , Quantification and phenotypic analysis of OT-II pT reg cells in the lymph nodes ( n = 16 samples per group).
e , Representative flow cytometry plots and quantification of FOXP3 + and RORγt + FOXP3 + OT-II cell frequencies and absolute numbers.
f , Representative flow cytometry plots and quantification of CD103 + FOXP3 + and IL-10 + FOXP3 + OT-II cell frequencies.
g , Representative flow cytometry plots and quantification showing expression of the indicated molecules on OT-II pT reg cells.
h – k , Therapeutic effect of TGM1–IL-2 in OVA-induced airway inflammation model (mock, n = 4 mice; PBS, n = 6 mice; TGM1–IL-2(WT), n = 7 mice; TGM1–IL-2(DN), n = 6 mice).
h , Representative lung histology and quantification of inflammation scores.
Scale bars, 1 mm.
i , Quantification of serum levels of OVA-specific IgE and IgG1.
j , k , Representative flow cytometry plots ( j ) and quantification of CD11c − SIGLECF + eosinophil frequencies ( j ) and absolute numbers ( k ) among CD45.2 + CD11b + cells in the indicated tissues.
Data are presented as mean ± s.e.m.
Data in b – k are representative of two independent experiments.
Statistics were obtained by one-way ANOVA coupled with Tukey’s multiple-comparisons test ( e – k ).
In in vivo OT-II pT reg cell induction assays, IL-2(DN) and TGM1–IL-2(DN) caused no notable weight loss or splenomegaly (Extended Data Fig.
9f,g ).
Compared with TGM1–IL-2(WT), TGM1–IL-2(DN) induced a lower fraction of OT-II pT reg cells in the lymph nodes, particularly RORγt + pT reg cells; however, relative to low-affinity TGM1, TGM1–IL-2(DN) increased pT reg cell frequency while reducing T FH and T H 17 cells (Fig.
5e and Extended Data Fig.
9h ).
TGM1–IL-2(DN) also markedly decreased OT-II cell numbers and Ki-67 + cell proliferation, resulting in fewer total and RORγt + OT-II pT reg cells, and reduced T-bet expression and IFNγ production in OT-II cells (Fig.
5e and Extended Data Fig.
9i-k ).
Phenotypically, OT-II pT reg cells induced by TGM1–IL-2(DN) showed reduced proportions of CD103 + and IL-10 + cells, lower expression of activation markers (CD25, ICOS and GITR), suppressive molecules (CTLA4, CD39 and CD73) and CXCR3, but increased NRP1 compared with TGM1–IL-2(WT) (Fig.
5f,g and Extended Data Fig.
9l ).
Notably, TGM1–IL-2(DN) conferred markedly less protection than TGM1–IL-2(WT) in the OVA-induced airway inflammation model, evidenced by higher lung inflammation scores, increased total serum IgE and OVA-specific IgE and IgG1, and greater infiltration of CD45.2 + immune cells (including CD11b + myeloid cells and CD3 + T cells) in the lung and BALF, with a pronounced increase in eosinophil frequency and numbers (Fig.
5h–k and Extended Data Fig.
9m,n ).
Consistently, TGM1–IL-2(DN) markedly reduced OT-II pT reg cell frequency and numbers in the LDLNs, particularly the CD25-expressing and IL-10-producing subsets (Extended Data Fig.
9o ).
These data show that IL-2 signalling in TGM1–IL-2 is required for optimal pT reg cell differentiation, expansion and functional maturation in vivo, thereby establishing tolerance.
Transcriptomic profiling of induced pT reg cells
Next, we performed single-cell RNA sequencing (scRNA-seq) on donor OT-II cells from the OVA-immunized mice treated with PBS, IL-2(WT), TGM1–IL-2(WT) or TGM1–IL-2(DN), together with endogenous Foxp3 -GFP + CD4 + T cells from PBS or IL-2(N88D) groups as controls (Fig.
6a ).
Unsupervised dimensionality reduction identified five clusters, in which donor OT-II cells were distributed mainly across clusters 1, 2 and 3 and showed increased expression of TCR signalling genes ( Batf , Irf4 , Egr1 , Ctla4 , Icos and Nfkbia ), consistent with OVA-driven activation (Fig.
6b–d ).
Cluster 1 was annotated as a T conv population, showing minimal Foxp3 expression but high levels of T conv genes, including markers of T FH ( Bcl6 , Tox2 , Cxcr5 , Il21 , Pdcd1 and Slamf6 ), T H 2 ( Gata3 and Il4 ), T H 1 ( Ifng ) and naive ( Tcf7 , Slamf6 and Ccr7 ) cells; clusters 2 and 3 were annotated as pT reg cell populations on the basis of enriched expression of pT reg cell transcription factors ( Foxp3 and Rorc ), surface molecules ( Cd25 , Itgae , Nt5e , Entpd1 and Tigit ), suppressive cytokines ( Il10 ) and chemokine receptors ( Cxcr3 , Ccr6 , Ccr9 and Cxcr6 ) (Fig.
6b,d and Extended Data Fig.
10a–d ).
Cluster 3 was further defined as a proliferative Ki-67 + pT reg cell subset on the basis of high expression of proliferation and cell cycle-associated genes and pathways, along with markedly increased S phase and G2/M phase cell cycle scores (Fig.
6b,d and Extended Data Fig.
10a,e,f ).
By contrast, endogenous Foxp3 -GFP + cells were mainly found in clusters 4 and 5, representing bystander tT reg cell populations with high expression of Foxp3 , Ikzf2 , Sell and Nrp1 and transcriptional profiles that were distinct from OT-II pT reg cell clusters 2 and 3 (Fig.
6b,d and Extended Data Fig.
10g ).
Cluster 5 was further identified as a proliferative Ki-67 + tT reg cell subset owing to increased expression of proliferation-associated genes (Fig.
6b,d and Extended Data Fig.
10a ).
Fig.
6: Transcriptomic profiling of pT reg cells induced by IL-2–TGFβ co-agonists in vivo.
a , Schematic illustration of the scRNA-seq sample collection workflow.
FACS, fluorescence-activated cell sorting.
Created in BioRender; Sun, Q.
https://BioRender.com/dgxkovg (2026).
b , Uniform manifold approximation and projection (UMAP) plot showing distinct cell clusters.
c , UMAP plots showing the distribution of OT-II cells across clusters.
d , Bubble plot illustrating the expression of selected genes across clusters.
Prolif, proliferation.
e , Bar plots showing the distribution of cells within distinct clusters.
f , Representative flow cytometry plots and quantification of Ki-67 and IL-10 expression ( n = 16 samples per group) and BLIMP1 expression ( n = 7 samples per group) in OT-II pT reg cells from lymph nodes.
g , Violin plots showing the expression of terminal effector (Gene Expression Omnibus (GEO) GSE207969 ) and colonic RORγt + T reg cell (GEO GSE160053 ) signature gene sets across indicated clusters and samples.
h , Violin plots showing expression of the indicated gene sets in cells from clusters 2 and 3.
i , Heat map of selected gene expression across clusters.
j , Representative flow cytometry plots and quantification of expression of the indicated molecules in the specified CD4 + T cell subsets ( n = 8 samples per group).
k , Representative flow cytometry plots and quantification of RORγt and CCR6 expression ( n = 16 samples per group) and c-MAF and CXCR6 expression ( n = 7 samples per group) in OT-II pT reg cells from lymph nodes.
l – o , Therapeutic effect of TGM1–IL-2 in the dextran sulfate sodium (DSS)-induced colitis model (PBS, n = 9 mice; TGM1–IL-2, n = 10 mice).
l , Schematic illustration.
Created in BioRender; Sun, Q.
https://BioRender.com/0fn86uv (2026).
m , Quantification of mean changes in body mass.
n , Representative colon images and quantification of colon lengths.
o , Representative colon histology (left) and inflammation scores (right).
Scale bars, 1 mm.
p , Gene regulatory networks and signature genes identified by scRNA-seq analysis, enumerated below.
Numbers in parentheses below boxes (bottom) represent the specific values from the Venn diagram in Extended Data Fig.
12f (left).
TFs, transcription factors.
Data are presented as mean ± s.e.m.
Data in f and j – o are representative of two independent experiments.
Statistics were obtained by unpaired Welch’s t -test (two-tailed) ( f , h , k , n , o ), one-way ANOVA coupled with Tukey’s multiple-comparisons test ( j ) or two-way ANOVA coupled with Šídák’s multiple-comparisons test ( m ).
Source Data Full size image
a , Schematic illustration of the scRNA-seq sample collection workflow.
FACS, fluorescence-activated cell sorting.
Created in BioRender; Sun, Q.
https://BioRender.com/dgxkovg (2026).
b , Uniform manifold approximation and projection (UMAP) plot showing distinct cell clusters.
c , UMAP plots showing the distribution of OT-II cells across clusters.
d , Bubble plot illustrating the expression of selected genes across clusters.
Prolif, proliferation.
e , Bar plots showing the distribution of cells within distinct clusters.
f , Representative flow cytometry plots and quantification of Ki-67 and IL-10 expression ( n = 16 samples per group) and BLIMP1 expression ( n = 7 samples per group) in OT-II pT reg cells from lymph nodes.
g , Violin plots showing the expression of terminal effector (Gene Expression Omnibus (GEO) GSE207969 ) and colonic RORγt + T reg cell (GEO GSE160053 ) signature gene sets across indicated clusters and samples.
h , Violin plots showing expression of the indicated gene sets in cells from clusters 2 and 3.
i , Heat map of selected gene expression across clusters.
j , Representative flow cytometry plots and quantification of expression of the indicated molecules in the specified CD4 + T cell subsets ( n = 8 samples per group).
k , Representative flow cytometry plots and quantification of RORγt and CCR6 expression ( n = 16 samples per group) and c-MAF and CXCR6 expression ( n = 7 samples per group) in OT-II pT reg cells from lymph nodes.
l – o , Therapeutic effect of TGM1–IL-2 in the dextran sulfate sodium (DSS)-induced colitis model (PBS, n = 9 mice; TGM1–IL-2, n = 10 mice).
l , Schematic illustration.
Created in BioRender; Sun, Q.
https://BioRender.com/0fn86uv (2026).
m , Quantification of mean changes in body mass.
n , Representative colon images and quantification of colon lengths.
o , Representative colon histology (left) and inflammation scores (right).
Scale bars, 1 mm.
p , Gene regulatory networks and signature genes identified by scRNA-seq analysis, enumerated below.
Numbers in parentheses below boxes (bottom) represent the specific values from the Venn diagram in Extended Data Fig.
12f (left).
TFs, transcription factors.
Data are presented as mean ± s.e.m.
Data in f and j – o are representative of two independent experiments.
Statistics were obtained by unpaired Welch’s t -test (two-tailed) ( f , h , k , n , o ), one-way ANOVA coupled with Tukey’s multiple-comparisons test ( j ) or two-way ANOVA coupled with Šídák’s multiple-comparisons test ( m ).
OT-II cells from the PBS and IL-2(WT) groups mapped almost exclusively to the T conv cluster 1, whereas a substantial fraction from the TGM1–IL-2(WT) and TGM1–IL-2(DN) groups localized to the pT reg clusters 2 and 3 (Fig.
6b,c,e ).
Consistently, OT-II cells from both the TGM1–IL-2(WT) and TGM1–IL-2(DN) groups, as well as cells in pT reg clusters 2 and 3, showed higher expression of a TGFβ signalling gene set (Extended Data Fig.
11a and Supplementary Table 1 ).
Notably, relative to the TGM1–IL-2(WT) group, a substantially smaller fraction of OT-II cells from the TGM1–IL-2(DN) group mapped to cluster 2, with minimal representation in cluster 3 (Fig.
6b,c,e ).
Consistently, TGM1–IL-2(WT) OT-II cells showed stronger enrichment of IL-2/STAT5-promoted gene sets and a higher proportion of Ki-67 + cells than TGM1–IL-2(DN) cells (Fig.
6f , Extended Data Fig.
11a and Supplementary Table 1 ).
Similarly, endogenous Foxp3 -GFP + cells from IL-2(N88D)-treated mice were more enriched in the proliferating tT reg cluster 5 than those from PBS-treated mice (Fig.
6b,e ).
These results further demonstrate that IL-2 is required for optimal pT reg differentiation and to drive T reg proliferation.
Moreover, OT-II cells in the pT reg and proliferating pT reg clusters 2 and 3, particularly from the TGM1–IL-2(WT) group, were strongly enriched for activated and terminal effector T reg gene signatures 31 , 32 , whereas OT-II cells from the TGM1–IL-2(DN) group showed reduced enrichment (Fig.
6g,h , Extended Data Fig.
11b–d and Supplementary Table 1 ).
Consistently, TGM1–IL-2(DN)-induced OT-II pT reg cells exhibited reduced IL-10 production and BLIMP1 expression compared with those induced by TGM1–IL-2(WT) (Fig.
6f ).
Moreover, a colonic T reg cell signature and a RORγt + colonic T reg cell programme from two independent studies were strongly enriched in OT-II cells from the TGM1–IL-2(WT) group, moderately enriched in the TGM1–IL-2(DN) group, and minimally expressed in endogenous T reg cells, and were also enriched in pT reg clusters 2 and 3 (refs.
33 , 34 ) (Fig.
6g,h , Extended Data Fig.
11e,f and Supplementary Table 1 ).
Specifically, these cells expressed higher levels of genes encoding colonic RORγt + T reg transcription factors ( Rorc and Maf ), migration molecules ( Ccr4 , Ccr5 , Ccr6 and Cxcr6 ) and immunoregulatory molecules ( Il10 , Ctla4 , Tmem176a and Lgals1 ) (Fig.
6i ).
Consistently, TGM1–IL-2(WT) induced higher protein expression of RORγt, c-MAF, CXCR6 and CCR6 in OT-II pT reg cells, with levels exceeding those in endogenous colonic T reg cells (Fig.
6j ).
However, OT-II cells from the TGM1–IL-2(DN) group, particularly the pT reg cell subpopulation, exhibited reduced expression of the RORγt + colonic T reg cell signature and decreased frequencies of RORγt + , CXCR6 + and CCR6 + OT-II pT reg cells, whereas c-MAF levels remained similar (Fig.
6h,k ).
We then assessed whether these OT-II pT reg cells could suppress intestinal inflammation by administering DSS and OVA orally after cell induction (Fig.
6l ).
Mice pretreated with TGM1–IL-2(WT) exhibited delayed and attenuated weight loss, preserved colon length and reduced histological inflammation scores compared with PBS controls (Fig.
6m–o and Extended Data Fig.
12a ).
The proportion of IFNγ–producing colonic CD4 + T cells decreased, whereas IL-17A–producing cells were unchanged (Extended Data Fig.
12b ).
Moreover, FOXP3 + OT-II cells represented a substantially higher fraction of total CD4 + T cells in the small intestine and colon compared with mLNs and Peyer’s patches, and were predominantly RORγt + GATA3 − (Extended Data Fig.
12c,d ).
These findings indicate that TGM1–IL-2 programs pT reg cells with an RORγt + effector, colonic-like phenotype in peripheral lymphoid organs, enhancing migration and suppression of intestinal inflammation.
Transcription factor activity analysis revealed increased FOXP3, SMAD3, RORγt and BLIMP1 activity in pT reg clusters 2 and 3, with reduced Helios and BCL6 activity (Extended Data Fig.
12e ).
Finally, an overlap analysis of differentially expressed genes identified 168 TGFβ-induced genes, 343 IL-2-induced genes, and 270 genes that were co-induced by both pathways (Fig.
6p , Extended Data Fig.
12f and Supplementary Table 2 ).
TGFβ uniquely upregulated T reg cell identity transcription factors ( Foxp3 , Smad3 and Rarg ); IL-2 specifically induced proliferation ( Mki67 , Ccna2 , Ccnb1 and Mcm3 ) and activation ( Tbx21 , Irf8 , Runx2 and Cxcr3 ) genes; and coordinated activation of both pathways induced an effector and RORγt + pT reg programme that included transcription factors ( Rorc , Rora , Maf , Prdm1 and Fli1 ), immunoregulatory molecules ( Il10 , Ctla4 and Tigit ), activation markers ( Il2ra , Icos , Havcr2 and Pvrig ), migration-related genes ( Ccr5 , Ccr9 , Cxcr6 and Itgae ) and other functional mediators ( Emp1 , Furin , Ltb4r1 and F2r ) (Fig.
6p ).
Similarly, we identified 132 TGFβ-suppressed genes, 548 IL-2-suppressed genes, and 483 genes that were co-suppressed by activation of both pathways (Extended Data Fig.
12f,g and Supplementary Table 3 ).
TGFβ alone suppressed activation ( Tbx21 , Nr4a2 , Il2 , Il12rb2 , Gzmk and Nkg7 ) and proliferation genes ( Cdca3 , Cdca5 , Ccnb1 , Ccna2 and Cdc25c ), opposing IL-2 induced signatures; IL-2 alone suppressed naive and stemness genes ( Tcf7 , Id3 , Ikzf2 , Sox4 and Tgfbr3 ); and combined TGFβ and IL-2 suppressed alternative CD4 + T cell lineage programmes, including T FH ( Bcl6 , Ascl2 and Il21 ), T H 1 ( Ifng ) and T H 2 ( Il4 ) programmes (Extended Data Fig.
12g ).
Thus, although TGFβ and IL-2 antagonistically regulate proliferation and activation, their coordination together with TCR stimulation robustly drives pT reg cell differentiation, expansion and functional maturation while suppressing alternative CD4 + T cell fates in vivo (Extended Data Fig.
12h ).
TGFβ is a potent but dangerous and challenging cytokine to harness for therapeutic applications 23 , yet modulating T reg cells is a desirable therapeutic area for TGFβ agonism in autoimmune and inflammatory diseases.
Current T reg cell therapies mainly expand polyclonal tT reg cells using IL-2 agents, but the expansion is short-lived, tissue-specific precursors remain low, and bystander tT reg cells lack antigen specificity, limiting efficacy and increasing systemic immunosuppression risk 35 , 36 .
As an alternative, antigen-specific pT reg cells offer targeted control of pathological immune responses while preserving overall immune function 37 , and our findings advance this paradigm by using a designed IL-2–TGFβ co-agonist to robustly induce these cells in vivo.
This agonist also suppresses T H 1 and T FH cell differentiation, providing dual immunosuppression by inducing pTreg cells and inhibiting pro-inflammatory subsets.
Although the helminth-derived TGM1 component in this co-agonist (D1–D3) has a foreign origin, we observed no loss of exposure in vivo, but anti-drug antibodies could still limit its use in humans.
TGM1 is composed of tandem immunoglobulin domains resembling variable heavy chain (V H H) fragments, so a more human-tolerable drug-like TGFβ mimic could be built from tandem V H H domains, which have been shown to act as surrogate cytokine agonists 38 .
RORγt + APCs have been implicated in inducing food antigen and microbiota-driven pT reg cells in the gut 15 , 16 , 17 , 18 , 19 , 39 , 40 , 41 , 42 .
Unlike oral antigen administration, intraperitoneal antigens plus TGM1–IL-2 efficiently induces pT reg cells systemically, including in lymphoid organs that are distant from the gut, suggesting that it is likely to provide sufficient in vivo inductive signals without requiring RORγt + APCs.
Additionally, the instability of pT reg cells limits their therapeutic use, but in vivo TGM1–IL-2-induced pT reg cells persist and remain functionally stable after multiple antigen re-challenges in disease, suggesting that coordinated IL-2 and TGFβ signalling may also be sufficient to generate durable pT reg cells without co-factors (such as retinoic acid or vitamin C) 43 , 44 .
T reg cell development is governed by a transcriptional network involving FOXP3, RORγt and BLIMP1 that integrates TGFβ and IL-2 signals to ensure appropriate T reg cell differentiation and function after antigen stimulation 45 .
This T reg programming framework may provide a platform to reprogram other CD4 + T cell lineage commitments using bi-specific agonists that pair distinct cytokine-STAT programmes with TGFβ–SMAD2/3 signalling to induce lineage-specific transcription factors.
Six-to-eight-week-old female and male C57BL/6 J mice (IMSR_JAX:000664), as well as other strains, were purchased from The Jackson Laboratory.
OT-II (IMSR_JAX:004194) and Thy1.1 (IMSR_JAX:000406) mice were crossed to generate OT-II Thy1.1 mice.
Foxp3 -GFP mice (IMSR_JAX:006772) were crossed with OT-II Thy1.1 mice.
2D2 mice (IMSR_JAX:006912) were crossed with Thy1.1 mice.
All animals were housed in AAALAC-accredited facilities.
Sample sizes were not predetermined but are reported with each result, and randomization was performed across littermates.
The following antibodies were purchased from BioLegend: mouse CD45.2 (109839), CD3 (100206), CD4 (100453, 100430, 100428, 100451), CD8 (100706), NK1.1 (156506), TCRvα2 (127806, 127822), TCRvα3.2 (135404), Thy1.1 (202528, 202522), CTLA4 (106310), CD62L (104453), CD25 (102012, 102022, 102047, 102038), CD44 (103026, 103032), SIGLECF (155534), CD73 (127215), ICOS (313550), CD69 (104530), CD11b (101259), CXCR3 (126514), CD39 (143806), NRP1 (145218), CD11c (117318), CD103 (110910), GITR (126316), CXCR6 (151117), CCR6 (129819), IL-17A (506928), GM-CSF (505406), IFNγ (505832, 505826), IL-10 (505034, 505026, 505034), BLIMP1 (150008), Helios (137214), Ki-67 (151212, 652406), TNFα (506346); human CD3 (317324), CD4 (980806) and FOXP3 (320126).
The following antibodies were purchased from BD Biosciences: mouse BCL6 (562401), RORγt (564722, 562682, 562683), SMAD2 (pS465/pS467)/SMAD3 (pS423/pS425) (562696) and STAT5 (pY694) (612599).
The following antibodies and reagents were purchased from Invitrogen: mouse PD-1 (48-9985-82), FOXP3 (12-5773-82, 17-5773-82, 404-5773-82), T-bet (25-5825-82), c-MAF (53-9855-82), GATA3 (46-9966-42) and Fixable Viability Dye (65-0865-18).
PE- and Brilliant Violet 421-labelled I-A b OVA 328–337 tetramers (HAAHAEINEA) were provided by the NIH Tetramer Core Facility.
For surface marker staining, live cells were incubated with antibodies and viability dye in PBS at 4 °C for 1 h.
Dead cells were excluded on the basis of viability dye staining.
For I-A b OVA 328–337 tetramer staining, live cells were first incubated with tetramers in PBS at 37 °C for 1 h, followed by surface antibody and viability dye staining.
For transcription factor and cytokine staining, cells were fixed and permeabilized using the FOXP3/Transcription Factor Staining Buffer Set (00-5521-00, Invitrogen), followed by intracellular staining at room temperature for 2 h.
Prior to cytokine staining, cells were stimulated with Cell Stimulation Cocktail (00-4970-03, Invitrogen) and Protein Transport Inhibitor Cocktail (00-4980-03, Invitrogen) at 37 °C for 5 h.
For pSMAD2/3 and pSTAT5 staining, freshly isolated T cells were stimulated ex vivo with the indicated proteins for 25 min, then were immediately fixed with Cytofix Fixation Buffer (554655, BD) and permeabilized using Phosflow Perm Buffer III (558050, BD).
Cells were resuspended in PBS and analysed on CytoFLEX flow cytometer (Beckman Coulter).
Data analysis was performed using FlowJo software v.10.10.0.
Recombinant proteins were cloned into the pD649 mammalian expression vector (ATUM), which includes a haemagglutinin (HA) secretion signal peptide, an N-terminal MSA fusion, and a C-terminal 6×His tag.
Expression constructs were transfected into Expi293F cells using the Expi293 Expression System (Gibco).
After 3–4 days of culture, proteins were purified from supernatants by Ni-NTA Agarose (Qiagen), followed by size-exclusion chromatography using a Superdex 200 column in ÄKTA chromatography system (Cytiva).
Endotoxin was removed using the Proteus NoEndo HC Spin Column Kit (VivaProducts), and levels were confirmed to be acceptable using the Pierce Chromogenic Endotoxin Quant Kit (Thermo Fisher Scientific).
Final protein preparations were formulated and concentrated in sterile PBS, flash-frozen in liquid nitrogen, and stored at −80 °C until use.
CD4 + T cell isolation and in vitro differentiation
Mouse lymph nodes and spleens were collected and mechanically dissociated to obtain single-cell suspensions.
Red blood cells were lysed using ACK lysis buffer (A10492-01, Gibco), followed by magnetic isolation of CD4 + T cells using the EasySep Mouse CD4 + T Cell Isolation Kit (19852, STEMCELL).
Naive CD4 + T cells (CD4 + CD44 − CD25 − Foxp3 -GFP − ) and activated CD4 + T conv cells (CD4 + CD44 + CD25 − Foxp3 -GFP − ) were subsequently sorted using a Sony SH800S Cell Sorter.
The purity of the sorted populations was consistently greater than 99%.
Human CD4 + T cells were isolated from frozen PBMCs using the EasySep Human CD4 + T Cell Isolation Kit (17952, STEMCELL).
Complete medium was prepared using RPMI 1640 with GlutaMAX supplement (Gibco, 61870036) and supplemented with 10% fetal bovine serum (Gibco, A5256701), 10 mM HEPES (Gibco, 15630080), 1% sodium pyruvate (Gibco, 11360070), 1% penicillin–streptomycin (Gibco, 15140122) and 0.1% 2-mercaptoethanol (Gibco, 21985023).
For the in vitro mouse CD4 + T cell differentiation assay, naive CD4 + T cells were plated at 0.75 × 10 6 cells per ml in flat-bottom 96-well plates pre-coated overnight with 5 μg ml −1 InVivoMAb anti-mouse CD3 (Bio X Cell, BE0002) and 5 μg ml −1 InVivoMAb anti-mouse CD28 (Bio X Cell, BE0015-1).
For OT-II cell differentiation, mouse splenocytes were plated at 1.5 × 10 6 cells per ml in flat-bottom 96-well plates and stimulated with 0.05 μg ml −1 OVA 323–339 peptide (GenScript, RP10610).
For human CD4 + T cell differentiation, CD4 + T cells were plated at 0.75 × 10 6 cells per ml in flat-bottom 96-well plates pre-coated overnight with InVivoMAb anti-human CD3 (Bio X Cell, BE0001-2) and 5 μg ml −1 InVivoMAb anti-human CD28 (Bio X Cell, BE0248).
Recombinant proteins were added at the indicated concentrations at the start of the culture, and cells were incubated at 37 °C for ~4 days.
Thy1.1 + mouse naive CD4 + T cells were labelled with CellTrace Violet Cell Proliferation Dye (Invitrogen, C34571) and plated at 0.1 × 10 6 cells per well in flat-bottom 96-well plates pre-coated with 5 μg ml −1 anti-CD3 and 5 μg ml −1 anti-CD28 antibodies.
Thy1.1 − mouse T conv cells or in vitro–differentiated pT reg cells generated with 1 nM proteins were added at the indicated ratios.
Thy1.1 + cells were analysed after 48 h of co-culture.
Naive OT-II cell transfer and OVA administration
One million sorted Thy1.1 + naive OT-II cells were adoptively transferred into Thy1.1 − C57BL/6 recipient mice via retro-orbital intravenous injection.
Starting one day post-transfer, mice were administered 100 μg OVA protein (A5503, Sigma-Aldrich) along with 50 pmol of the indicated proteins via intraperitoneal injection every other day, for a total of six injections.
On day 11, mLN, ILN, and spleens were collected for analysis.
For FTY720 treatment, 20 µg FTY720·HCl (ENZO Life Sciences) was dissolved in 100 µl of 5% DMSO in PBS and administered via intraperitoneal injection daily from day 0 to day 10, for a total of 11 doses.
OVA-induced airway inflammation model
One million sorted Thy1.1 + naive OT-II cells were adoptively transferred into Thy1.1 − C57BL/6 recipient mice, followed by five intraperitoneal injections of 100 μg OVA protein combined with 50 pmol of the indicated proteins.
One week after the final injection, mice received three weekly intraperitoneal injections of 100 μg OVA protein formulated in 150 μl Alhydrogel adjuvant (2%; InvivoGen, vac-alu-50).
One week after the last adjuvant injection, mice were administered three intranasal doses of 100 μg OVA protein every other day.
Tissues were collected and analysed one day after the final intranasal dose.
One million sorted Thy1.1 + naive OT-II cells were adoptively transferred into Thy1.1 − C57BL/6 recipient mice, followed by five intraperitoneal injections of 100 μg OVA protein combined with 50 pmol of the indicated proteins.
One week after the final injection, mice received three weekly oral gavages of 5 mg OVA protein together with 10 µg cholera toxin (C8052, Sigma-Aldrich).
Donor OT-II cells in the gut were analysed one day after the last gavage.
One week later, mice were challenged with 200 µg OVA protein via intraperitoneal injection.
Rectal temperature was recorded immediately thereafter every 5–10 min for 75 min using a Type J/K/T thermocouple thermometer (Kent Scientific), and serum was collected one day later for analysis.
Naive 2D2 cell transfer and MOG 35–55 administration
Three million sorted Thy1.1 + naive CD44 − CD25 − 2D2 cells were adoptively transferred into female Thy1.1 − C57BL/6 recipient mice via retro-orbital intravenous injection.
Beginning one day after transfer, mice received 40 µg MOG 35–55 peptide (Genemed Synthesis) together with 50 pmol of the indicated proteins by intraperitoneal injection every other day, for a total of six doses.
On day 11, mLN, ILN and spleens were collected for analysis.
Female mice were administered 40 µg MOG 35–55 peptide together with 50 pmol of the indicated proteins every other day for a total of five doses.
One week later, mice were immunized subcutaneously with 100 µg MOG 35–55 peptide per mouse in incomplete Freund’s adjuvant (BD Biosciences) containing 200 µg Mycobacterium tuberculosis per mouse (BD Biosciences), injected at the axilla of both sides.
Concurrently, 400 ng pertussis toxin per mouse (PTX, List Labs) was administered intraperitoneally, with a second dose given 48 h later.
Mouse body weight and clinical signs of disease were recorded daily and scored according to the following scale: 1, tail paralysed; 1.5, mild hind limb weakness; 2, moderate/typical hind limb weakness; 2.5, severe hind limb weakness without paralysis; 3, one or both hind limbs paralysed, front limbs fully functional; 3.5, both hind limbs paralysed, front limbs/paws weak but not paralysed; 4, front limb paralysis; 5, moribund or deceased.
Tissues were collected and analysed on day 25.
Two million sorted Thy1.1 + naive OT-II cells were adoptively transferred into Thy1.1 − C57BL/6 recipient mice via retro-orbital intravenous injection.
Beginning one day after transfer, mice received 100 µg OVA protein together with 50 pmol of the indicated proteins by intraperitoneal injection every other day, for a total of five doses.
Two days later, the mice were given drinking water containing 2.5% DSS (colitis grade, 36,000–50,000; MP Biomedicals) supplemented with 2.5 mg ml −1 OVA protein.
Simultaneously, mice were administered 5 mg OVA protein via oral gavage every other day for a total of six doses.
After six days, the DSS- and OVA-supplemented water was replaced with regular drinking water.
Mouse body weight was recorded daily throughout the experiment, and tissues were collected and analysed at the endpoint.
Isolation of immune cells from tissues
Mice were euthanized after completion of the respective treatments.
BALF was collected by flushing the lungs three times with 0.75 ml of PBS via a catheter inserted into the trachea.
For lymphocyte isolation from the lung, tissues were mechanically dissociated using the plunger of a 1 ml syringe and filtered through 70-μm cell strainers to obtain single-cell suspensions.
For lymphocyte isolation from the lamina propria, Peyer’s patches in the small and large intestines were first removed.
The intestines were then opened longitudinally, cut into ~2-cm pieces, and incubated in 5 mM EDTA (15575020, Invitrogen) with 1 mM DTT (R0861, Thermo Fisher Scientific) at 37 °C for 30 min to remove epithelial cells.
Tissues were then minced and digested in DNase I (40 µg ml −1 ; Roche) and collagenase D (0.5 mg ml −1 ; Roche) at 37 °C for 30 min with shaking to generate single-cell suspensions, which were filtered through 70-μm cell strainers.
For lymphocyte isolation from the spinal cord, mice were first perfused, and the collected spinal cords were mechanically dissociated using the plunger of a 1 ml syringe and passed through 70-μm cell strainers to obtain single-cell suspensions.
The resulting cells were subjected to density gradient centrifugation using a 40%/70% Percoll (Cytiva) gradient.
Immune cells located at the interface between the two Percoll layers were collected and processed for flow cytometry analysis.
Blood samples were centrifuged at 3,000 g , and serum was collected from the supernatant.
Immunoglobulin levels were measured using ELISA kits: total IgE (ELISA MAX Standard Set Mouse IgE; BioLegend, 432401), OVA-specific IgE (LEGEND MAX Mouse OVA-Specific IgE ELISA Kit; BioLegend, 439807) and OVA-specific IgG1 (Mouse Anti-OVA IgG1 Antibody Assay Kit; Chondrex, 3013).
Lung tissues from perfused mice and colon tissues were fixed in 10% neutral buffered formalin (Sigma-Aldrich, HT501128) and submitted to S.
Avolicino for paraffin embedding, sectioning, and haematoxylin and eosin staining.
Slides were imaged on a Leica DM2000 microscope, and histopathology was evaluated in a blinded manner.
Lung inflammation was scored on the basis of the extent of peribronchial and perivascular cellular infiltration: 0, no infiltrates; 1, a few inflammatory cells; 2, a one-cell-thick ring of inflammatory cells; 3, a 2–3-cell-thick ring; 4, a 4–5-cell-thick ring; 5, a ring >5 cells thick.
Colon inflammation was scored as follows: 0, no evidence of inflammation; 1, low-level inflammation with scattered infiltrating mononuclear cells (1–2 foci); 2, moderate inflammation with multiple foci; 3, high-level inflammation with increased vascular density and marked wall thickening; 4, severe inflammation with transmural leukocyte infiltration and loss of goblet cells.
Donor OT-II cells and endogenous Foxp3 -GFP + CD4 + T cells were sorted from the mLNs of the respective treatment groups on day 11 and submitted to MedGenome for library preparation and RNA sequencing.
The FASTQ files were processed using Cell Ranger v.9.0.0.
The gene expression matrix was processed and analysed using Seurat (v.5.1.0) 46 .
For quality control, we excluded cells that contained fewer than 500 read counts for genes or fewer than 200 genes detected (minimal cutoff), or more than 50,000 read counts for genes or more than 6,500 genes detected (maximum cutoff).
We also excluded cells in which more than 20% of transcripts were derived from mitochondrial RNA.
These QC filters left 190,728 cells.
Graph-based unsupervised clustering was employed to identify clusters representing minor contaminant cells other than T cells, such as neurons (expressing Cntn1 , Dscam and Pde7b ) and B cells (expressing Igkc , Ms4a1 and Cd79a ).
These minor clusters were excluded from subsequent analyses, leaving 180,038 cells.
UMAP embedding was computed with 10 principal components, with n.neighbors being 20 and min.dist being 0.1.
Differential expression analysis between groups was performed using Wilcoxon’s rank sum test implemented in Seurat’s FindMarkers function.
Gene set enrichment analysis 47 was performed using the log 2 FC ranking of differentially expressed genes using fgsea.
Human hallmark gene sets were retrieved from MSigDB.
The signature scores were calculated using Seurat’s AddModuleScore function.
To calculate cell cycle score, we used the CellCycleScoring function in Seurat.
Built-in human gene sets for the S and G2M phases in Seurat were converted into mouse homologues and used to calculate S and G2M scores.
Transcription factor activity inference was conducted using pySCENIC with default parameter settings 48 .
To identify differentially expressed genes from public bulk RNA-seq datasets for computing gene set signature scores, bulk RNA-seq FASTQ files were aligned to the GENCODE VM25 (mm10) reference genome using Rsubread 49 , and gene expression was quantified with featureCounts 50 .
Differential expression analysis was performed using DESeq2 (ref.
51 ).
Pathway analysis was performed using Metascape 52 .
Statistical analyses were performed using GraphPad Prism 10.
Differences were considered statistically significant at P < 0.05, with significance denoted as follows: * P < 0.05, ** P < 0.01, *** P < 0.001 and **** P < 0.0001.
Detailed statistical information, including sample sizes, numbers of independent experiments, and the statistical tests used, is provided in the corresponding figure legends.
All experimental mouse procedures were approved by the Stanford University Institutional Animal Care and Use Committee (IACUC; protocol IDs 32279 and 34708) and conducted in accordance with institutional guidelines.
Blood for PBMC isolation from healthy donors was provided by the Stanford Blood Center, which also obtained ethical approval for the donors.
Further information on research design is available in the Nature Portfolio Reporting Summary linked to this article.
The raw and processed scRNA-seq data have been deposited in the Gene Expression Omnibus (GEO) under accession GSE315102 (aligned to the mm10 mouse reference genome).
Source data are provided with this paper.
The R code used to analyse the scRNA-seq data has been deposited on Zenodo ( https://doi.org/10.5281/zenodo.18166788 ) 53 .
Sakaguchi, S., Yamaguchi, T., Nomura, T.
& Ono, M.
Regulatory T cells and immune tolerance.
Cell 133 , 775–787 (2008).
Article ADS CAS PubMed Google Scholar
Bluestone, J.
A.
& Abbas, A.
K.
Natural versus adaptive regulatory T cells.
Nat.
Rev.
Immunol.
3 , 253–257 (2003).
Article CAS PubMed Google Scholar
Chen, W.
et al.
Conversion of peripheral CD4 + CD25 − naive T cells to CD4 + CD25 + regulatory T cells by TGF- β induction of transcription factor Foxp3.
J.
Exp.
Med.
198 , 1875–1886 (2003).
Article CAS PubMed PubMed Central Google Scholar
Josefowicz, S.
Z., Lu, L.
F.
& Rudensky, A.
Y.
Regulatory T cells: mechanisms of differentiation and function.
Annu.
Rev.
Immunol.
30 , 531–564 (2012).
Zheng, S.
G., Wang, J., Wang, P., Gray, J.
D.
& Horwitz, D.
A.
IL-2 is essential for TGF-β to convert naive CD4 + CD25 − cells to CD25 + Foxp3 + regulatory T cells and for expansion of these cells.
J.
Immunol.
178 , 2018–2027 (2007).
Johnston, C.
J.
C.
et al.
A structurally distinct TGF-β mimic from an intestinal Helminth parasite potently induces regulatory T cells.
Nat.
Commun.
8 , 1741 (2017).
Article ADS PubMed PubMed Central Google Scholar
Chen, W.
TGF- β regulation of T cells.
Annu.
Rev.
Immunol.
41 , 483–512 (2023).
Article PubMed PubMed Central Google Scholar
Dong, C.
Cytokine regulation and function in T cells.
Annu.
Rev.
Immunol.
39 , 51–76 (2021).
Hori, S., Nomura, T.
& Sakaguchi, S.
Control of regulatory T cell development by the transcription factor Foxp3.
Science 299 , 1057–1061 (2003).
Fontenot, J.
D., Gavin, M.
A.
& Rudensky, A.
Y.
Foxp3 programs the development and function of CD4 + CD25 + regulatory T cells.
Nat.
Immunol.
4 , 330–336 (2003).
Sakaguchi, S.
Naturally arising CD4 + regulatory T cells for immunologic self-tolerance and negative control of immune responses.
Annu.
Rev.
Immunol.
22 , 531–562(2004).
Chinen, T.
et al.
An essential role for the IL-2 receptor in T reg cell function.
Nat.
Immunol.
17 , 1322–1333 (2016).
Kedmi, R.
et al.
A RORγt + cell instructs gut microbiota-specific T reg cell differentiation.
Nature 610 , 737–743 (2022).
Article ADS CAS PubMed PubMed Central Google Scholar
Rudnitsky, A.
et al.
A coordinated cellular network regulates tolerance to food.
Nature 644 , 231–240 (2025).
Sun, I.-H.
et al.
RORγt eTACs mediate oral tolerance and Treg induction.
J.
Exp.
Med.
222 , e20250573 (2025).
Akagbosu, B.
et al.
Novel antigen-presenting cell imparts T reg -dependent tolerance to gut microbiota.
Nature 610 , 752–760 (2022).
Cabric, V.
et al.
A wave of Thetis cells imparts tolerance to food antigens early in life.
Science 389 , 268–274 (2025).
Ramanan, D.
et al.
Regulatory T cells in the face of the intestinal microbiota.
Nat.
Rev.
Immunol.
23 , 749–762 (2023).
Yang, X.
O.
et al.
Molecular antagonism and plasticity of regulatory and inflammatory T cell programs.
Immunity 29 , 44–56 (2008).
Chung, Y.
et al.
Critical regulation of early Th17 cell differentiation by interleukin-1 signaling.
Immunity 30 , 576–587 (2009).
Massague, J.
& Sheppard, D.
TGF-β signaling in health and disease.
Cell 186 , 4007–4037 (2023).
Peterson, L.
B.
et al.
A long-lived IL-2 mutein that selectively activates and expands regulatory T cells as a therapy for autoimmune disease.
J.
Autoimmun.
95 , 1–14 (2018).
Shanafelt, A.
B.
et al.
A T-cell-selective interleukin 2 mutein exhibits potent antitumor activity and is well tolerated in vivo.
Nat.
Biotechnol.
18 , 1197–1202 (2000).
van Dinther, M.
et al.
CD44 acts as a coreceptor for cell-specific enhancement of signaling and regulatory T cell induction by TGM1, a parasite TGF-β mimic.
Proc.
Natl Acad.
Sci.
USA 120 , e2302370120 (2023).
Mukundan, A.
et al.
Convergent evolution of a parasite-encoded complement control protein-scaffold to mimic binding of mammalian TGF-β to its receptors, TβRI and TβRII.
J.
Biol.
Chem.
298 , 101994 (2022).
Hinck, A.
P., Mueller, T.
D.
& Springer, T.
A.
Structural biology and evolution of the TGF-β family.
Cold Spring Harb.
Perspect.
Biol.
https://doi.org/10.1101/cshperspect.a022103 (2016).
Levin, A.
M.
et al.
Exploiting a natural conformational switch to engineer an interleukin-2 ‘superkine.
Nature 484 , 529–533 (2012).
Mitra, S.
et al.
Interleukin-2 activity can be fine tuned with engineered receptor signaling clamps.
Immunity 42 , 826–838 (2015).
He, M.
et al.
Dynamic Foxp3–chromatin interaction controls tunable Treg cell function.
J.
Exp.
Med.
221 , e20232068 (2024).
Dikiy, S.
et al.
Terminal differentiation and persistence of effector regulatory T cells essential for preventing intestinal inflammation.
Nat.
Immunol.
26 , 444–458 (2025).
Miragaia, R.
J.
et al.
Single-cell transcriptomics of regulatory T cells reveals trajectories of tissue adaptation.
Immunity 50 , 493–504.e497 (2019).
Kiner, E.
et al.
Gut CD4 + T cell phenotypes are a continuum molded by microbes, not by T H archetypes.
Nat.
Immunol.
22 , 216–228 (2021).
Sharabi, A.
et al.
Regulatory T cells in the treatment of disease.
Nat.
Rev.
Drug Discov.
17 , 823–844 (2018).
Wardell, C.
M., Boardman, D.
A.
& Levings, M.
K.
Harnessing the biology of regulatory T cells to treat disease.
Nat.
Rev.
Drug Discov.
24 , 93–111 (2025).
Selck, C.
& Dominguez-Villar, M.
Antigen-specific regulatory T cell therapy in autoimmune diseases and transplantation.
Front.
Immunol.
12 , 661875 (2021).
Yen, M.
et al.
Facile discovery of surrogate cytokine agonists.
Cell 185 , 1414–1430.e1419 (2022).
Lyu, M.
et al.
ILC3s select microbiota-specific regulatory T cells to establish tolerance in the gut.
Nature 610 , 744–751 (2022).
Fernandes Rodrigues, P.
et al.
Rorγt-positive dendritic cells are required for the induction of peripheral regulatory T cells in response to oral antigens.
Cell 188 , 2720–2737.e22 (2025).
Campos Canesso, M.
C.
et al.
Identification of antigen-presenting cell-T cell interactions driving immune responses to food.
Science 387 , eado5088 (2025).
Fu, L.
et al.
PRDM16-dependent antigen-presenting cells induce tolerance to gut antigens.
Nature 642 , 756–765 (2025).
Xiao, S.
et al.
Retinoic acid increases Foxp3 + regulatory T cells and inhibits development of Th17 cells by enhancing TGF-β-driven Smad3 signaling and inhibiting IL-6 and IL-23 receptor expression.
J.
Immunol.
181 , 2277–2284 (2008).
Yue, X.
et al.
Control of Foxp3 stability through modulation of TET activity.
J.
Exp.
Med.
213 , 377–397 (2016).
Trujillo-Ochoa, J.
L., Kazemian, M.
& Afzali, B.
The role of transcription factors in shaping regulatory T cell identity.
Nat.
Rev.
Immunol.
23 , 842–856 (2023).
Hao, Y.
et al.
Dictionary learning for integrative, multimodal and scalable single-cell analysis.
Nat.
Biotechnol.
42 , 293–304 (2024).
Subramanian, A.
et al.
Gene set enrichment analysis: a knowledge-based approach for interpreting genome-wide expression profiles.
Proc.
Natl Acad.
Sci.
USA 102 , 15545–15550 (2005).
Aibar, S.
et al.
SCENIC: single-cell regulatory network inference and clustering.
Nat.
Methods 14 , 1083–1086 (2017).
Liao, Y., Smyth, G.
K.
& Shi, W.
The Subread aligner: fast, accurate and scalable read mapping by seed-and-vote.
Nucleic Acids Res.
41 , e108 (2013).
Liao, Y., Smyth, G.
K.
& Shi, W.
featureCounts: an efficient general purpose program for assigning sequence reads to genomic features.
Bioinformatics 30 , 923–930 (2014).
Love, M.
I., Huber, W.
& Anders, S.
Moderated estimation of fold change and dispersion for RNA-seq data with DESeq2.
Genome Biol.
15 , 550 (2014).
Zhou, Y.
et al.
Metascape provides a biologist-oriented resource for the analysis of systems-level datasets.
Nat.
Commun.
10 , 1523 (2019).
Sun, Q.
& Ogishi, M.
Facile induction of immune tolerance by an interleukin-2-TGF-β surrogate agonist.
Zenodo https://doi.org/10.5281/zenodo.18166788 (2026).
We thank the Stanford Animal Care and Facilities and the Stanford Cell Sciences Imaging Facility for technical assistance.
We thank the US National Institutes of Health (NIH) Tetramer Core Facility (NIH contract 75N93020D00005 and RRID:SCR_026557) for providing OVA 328–337 tetramers.
We acknowledge support for this research from Howard Hughes Medical Institute (K.C.G.), NIH-R01-AI-51321 (K.C.G.), NIH-R01-AI-173189 (T.V.L.), Department of Defense HT9425-23-1-059 (T.V.L.), Yosemite Innovation Fund (K.C.G.) and Ludwig Institute (K.C.G.).
M.
Ogishi is supported by the NCI Predoctoral to Postdoctoral Fellow Transition (K00) award (4K00CA274708).
Department of Molecular and Cellular Physiology, Stanford University School of Medicine, Stanford, CA, USA
Qinli Sun, Masato Ogishi, Hua Jiang, Honghui Liu, Yang Zhao, Grayson E.
Rodriguez, Pingdong Tao, Matthias Obenaus, Karsten D.
Householder & K.
Christopher Garcia
Institute for Immunity, Transplantation, and Infection, Stanford University School of Medicine, Stanford, CA, USA
Alison K.
Barrett & Tobias V.
Lanz
Diabetes Center, University of California, San Francisco, CA, USA
Gladstone Institute-UCSF of Genomic Immunology, University of California, San Francisco, CA, USA
Program in Immunology, Stanford University School of Medicine, Stanford, CA, USA
Grayson E.
Rodriguez & Karsten D.
Householder
Parker Institute for Cancer Immunotherapy, San Francisco, CA, USA
Grayson E.
Rodriguez & K.
Christopher Garcia
Department of Surgery, University of California, San Francisco, CA, USA
Division of Immunology and Rheumatology, Stanford University School of Medicine, Stanford, CA, USA
Department of Structural Biology, Stanford University School of Medicine, Stanford, CA, USA
Howard Hughes Medical Institute, Stanford University School of Medicine, Stanford, CA, USA
Search author on: PubMed Google Scholar
K.C.G.
conceived the study, supervised the experiments and collaborated with the other authors on the manuscript.
Q.S.
designed and conducted all experiments, analysed the data and prepared the figures, manuscript and related materials.
A.K.B.
established the EAE model, recorded clinical scores and performed mouse perfusions.
M.
Ogishi processed the scRNA-seq data and wrote the corresponding methods section.
H.J., Y.Z., G.E.R.
and K.D.H.
assisted with mouse tissue processing.
H.
Liu assisted with BALF collection.
G.E.R.
provided the vector backbone and IL-2 plasmid and supported plasmid construction and protein purification.
P.T.
provided the IL-2 plasmid.
H.J.
and M.
Obenaus contributed to the ELISA experiments.
H.
Lyu and Q.T.
contributed to experimental design and manuscript preparation.
T.V.L.
supervised the EAE experiments and contributed to manuscript revision.
Correspondence to K.
Christopher Garcia .
K.C.G.
and Q.S.
have filed a provisional patent application on IL-2–TGFβ co-agonists (serial no.
63/924,993).
The other authors declare no competing interests.
Nature thanks the anonymous reviewer(s) for their contribution to the peer review of this work.
Peer reviewer reports are available.
Publisher’s note Springer Nature remains neutral with regard to jurisdictional claims in published maps and institutional affiliations.
Extended data figures and tables
Extended Data Fig.
1 Design and functional characterization of MSA-TGM1-IL-2 fusion proteins.
a , Plasmid construct encoding the MSA-TGM1-IL-2 fusion protein.
b , SDS-PAGE gel images of the indicated proteins.
For gel source data, see Supplementary Fig.
1 .
c , Ex vivo dose-response curves of pSTAT5 and pSMAD2/3 in primary CD25 - CD4 + T cells (n = 2 biological replicates).
d , Ex vivo dose-response curves of pSTAT5 and pSMAD2/3 in primary CD8 + T cells (n = 2 biological replicates).
e , Ex vivo dose-response curves of pSTAT5 and pSMAD2/3 in primary CD25 + CD4 + T cells (n = 1).
f , In vitro dose–response curves for Foxp3 + cell frequency in cultured mouse naïve CD4 + T cells (n = 2 biological replicates).
g , In vitro dose–response curves for Foxp3 + cell frequency and number in cultured mouse CD44 + Foxp3-GFP - CD4 + T cells (n = 1).
h , In vitro dose–response curves for FOXP3 + cell frequency and number in cultured human PBMC CD4 + T cells (n = 2 biological replicates).
i , CD25 expression on naïve T cells co-cultured in vitro with the indicated cells (n = 2 biological replicates).
Data are presented as mean ± s.e.m.
The data in b–i are representative of two or three independent experiments.
Extended Data Fig.
2 Regulation of CD4 + T cell activation, differentiation, and expansion by IL-2-TGF-β co-agonists in vitro .
a-c , In vitro dose–response curves for CD25 and CD69 expression ( a ) and the frequencies of IFN-γ + , TNF-α + , IL-17a + ( b ), and CD62L + cells ( c ) on cultured mouse naïve CD4 + T cells (n = 2 biological replicates).
d , In vitro dose–response curves for cell number in cultured mouse naïve CD4 + T cells (n = 2 biological replicates).
Data are presented as mean ± s.e.m.
The data in a–d are representative of two or three independent experiments.
Extended Data Fig.
3 Effect of IL-2-TGF-β co-agonists on IL-2R + immune cells in vivo under steady-state conditions.
a-k , Effect of TGM1–IL-2 on splenic immune cells at steady state (n = 4 mice/group).
a , Schematic illustration of in vivo protein administration.
Created in BioRender; Sun, Q.
https://BioRender.com/su1gufm (2026).
b, c , Mean ( b ) and individual ( c ) body weight change curves of indicated mice.
d, e , Representative spleen (SPL) images ( d ) and quantification of spleen weight ( e ) in the indicated mice.
f , Quantification of Foxp3 + cell frequencies among splenic CD4 + T cells and their ratios to CD8 + T and NK cells.
g , Quantification of Foxp3 + CD4 + T cell numbers in the spleens.
h , Representative flow cytometry plots and quantification of Ki-67 + Foxp3 + cell frequencies among the indicated cell populations.
i , Quantification of the numbers of the indicated cell populations in the spleens.
j, k , Quantification of Ki-67 + ( j ) and IFN-γ + cells ( k ) among the indicated splenic cell populations.
Data are presented as mean ± s.e.m.
The data in a–k are representative of two independent experiments.
The statistics were obtained by one-way ANOVA coupled with Tukey’s multiple-comparisons test ( e-h ) or Dunnett’s multiple-comparisons test ( i-k ).
Extended Data Fig.
4 Effect of IL-2-TGF-β co-agonists on Tregs in vivo under steady-state conditions.
Extended Data Fig.
5 Effect of IL-2-TGF-β co-agonists on OT-II pTreg induction in OVA-immunized mice.
a , In vitro dose–response curves for Foxp3 + cell frequency and number in cultured mouse naïve OT-II cells (n = 2 biological replicates).
b–e , Phenotypic analysis of OT-II cells, pTreg OT-II cells, and endogenous CD4 + T cells (n = 16 samples/group).
b , Representative flow cytometry plots and quantification of Helios + and Rorγt + cell frequencies among Foxp3 + OT-II cells in LNs.
c , Representative flow cytometry plots and quantification of Foxp3 + cell frequencies among OVA-tetramer + CD4 + T cells in LNs.
d , Quantification of the OT-II cell numbers in the indicated lymphoid organs.
e , Representative flow cytometry plots and quantification of Ki-67 + cell frequencies among OT-II cells in LNs.
f–k , OT-II pTreg cell induction in mice treated with FTY720 (n = 4 mice/group).
f , Schematic illustration created in BioRender; Sun, Q.
https://BioRender.com/essbx6h (2026).
g , Quantification of CD4 + T cell percentages among total live cells in blood.
h, i , Representative flow cytometry plots ( h ) and quantification ( i ) of CD25 + Foxp3 + OT-II cells in the indicated lymphoid organs.
j, k , Quantification of total ( j ) and indicated ( k ) OT-II cell numbers in the indicated lymphoid organs.
Data are presented as mean ± s.e.m.
The data in a–k are representative of two independent experiments.
The statistics were obtained by one-way ANOVA coupled with Dunnett’s multiple-comparisons test ( b–d ), one-way ANOVA coupled with Tukey’s multiple comparisons test ( e ), or unpaired Welch’s t-test (two-tailed) ( g and i–k ).
Extended Data Fig.
6 Phenotypic characterization of OT-II pTregs in peripheral lymphoid organs and the gut.
a–d , OT-II cell phenotypes after gut migration (n = 10 mice/group).
a , Schematic illustration of OVA administration in the drinking water.
Created in BioRender; Sun, Q.
https://BioRender.com/0njaeg9 (2026).
b–d , Representative flow cytometry plots ( b ) and quantification of the frequencies ( c ) and numbers ( d ) of the indicated OT-II cell subsets in the indicated tissues.
e–i , Phenotypic analysis of total and pTreg OT-II cells (n = 16 samples/group).
e , Gating strategy for identifying distinct subsets among donor OT-II cells.
f , Representative flow cytometry plots showing IFN-γ and IL-17a production by donor OT-II cells in LNs.
g , Quantification of TNF-α + OT-II cell frequencies in LNs.
h, i , Representative flow cytometry plots and quantification showing expression of the indicated molecules in the indicated CD4 + T cell subsets from LNs.
Data are presented as mean ± s.e.m.
The data in a–i are representative of two independent experiments.
The statistics were obtained by unpaired Welch’s t-test (two-tailed) ( c and d ) or one-way ANOVA coupled with Tukey’s multiple-comparisons test ( g ).
Extended Data Fig.
7 IL-2-TGF-β co-agonists establish immune tolerance to suppress OVA-induced airway inflammation.
a–f , Therapeutic effect of TGM1–IL-2 in establishing tolerance to suppress OVA-induced airway inflammation (Mock, n = 4 mice; treatment groups, n = 7 mice/group).
a , Quantification of serum toal IgE levels.
b , Quantification of the numbers of the indicated cell populations in the lung and BALF.
c , Representative flow cytometry plots and quantification of Foxp3 + and Rorγt + Foxp3 + OT-II cell frequencies and numbers in spleen.
d , Representative flow cytometry plots and quantification of CD25 + Foxp3 + and IL-10 + Foxp3 + OT-II cell frequencies and numbers in LDLNs.
e , Representative flow cytometry plots and quantification of ICOS + Foxp3 + , CD103 + Foxp3 + , and CD39 + Foxp3 + OT-II cell frequencies in LDLNs.
f , Quantification of Gata3 + Foxp3 - OT-II cell frequencies in LDLNs.
Data are presented as mean ± s.e.m.
The data in a–f are representative of two independent experiments.
The statistics were obtained by one-way ANOVA coupled with Dunnett’s multiple-comparisons test ( a–f ).
Extended Data Fig.
8 IL-2–TGF-β co-agonists establish immune tolerance to suppress MOG 35-55 -induced EAE.
a , Gating strategy for identifying MOG 35-55 -reactive 2D2 cells.
b , Representative flow cytometry plots and quantification of expression of the indicated markers in splenic 2D2 cells (n = 6 samples/group).
c–e , Therapeutic effect of TGM1–IL-2 in establishing tolerance to suppress MOG 35–55 -induced EAE (n = 11 mice/group).
c , Individual EAE scores for mice in the indicated groups.
d , Quantification of the numbers of the indicated cell populations in the spinal cord.
e , Representative flow cytometry plots and quantification of IFN-γ + and IL-17a + CD4 + T-cell frequencies in the spinal cord.
Data are presented as mean ± s.e.m.
The data in b–e are representative of two independent experiments.
The statistics were obtained by unpaired Welch’s t-test (two-tailed) ( b,d and e ).
Extended Data Fig.
9 IL-2-TGF-β co-agonists activate IL-2 signalling to enable optimal pTreg development and immune tolerance .
a , SDS-PAGE gel images of the indicated proteins.
For gel source data, see Supplementary Fig.
1 .
b , In vitro dose–response curves for Foxp3 + cell frequency and number in cultured mouse naïve CD4 + T cells (n = 2 biological replicates).
c , In vitro dose–response curves for cell number in cultured mouse naïve CD4 + T cells (n = 2 biological replicates).
d , in vitro dose–response curves for expression of the indicated molecules in cultured mouse naïve CD4 + T cells (n = 2 biological replicates).
e , CD25 expression on naïve T cells co-cultured in vitro with the indicated cells (n = 3 biological replicates).
f , Quantification of mean body weight changes (n = 4 mice/group).
g , Quantification of spleen weights (n = 4 mice/group).
h–l , Phenotypic analysis of total and pTreg OT-II cells in the LNs (n = 16 samples/group).
h , Histogram showing the distribution of distinct subsets among donor OT-II cells.
i , Quantification of the OT-II cell numbers.
j , Representative flow cytometry plots and quantification of Ki-67 and T-bet expression in OT-II cells.
k , Quantification of IFN-γ + OT-II cell frequencies.
l , Representative flow cytometry plots and quantification showing expression of the indicated molecules on OT-II pTregs.
m–o , Therapeutic effect of TGM1–IL-2 in OVA-induced airway inflammation (Mock, n = 4 mice; PBS, n = 6 mice; TGM1–IL-2WT, n = 7 mice; TGM1–IL-2DN, n = 6 mice).
m , Quantification of serum toal IgE levels.
n , Quantification of the numbers of the indicated cell populations in the lung and BALF.
o , Representative flow cytometry plots and quantification of CD25 + Foxp3 + and IL-10 + Foxp3 + OT-II cell frequencies and numbers in LDLNs.
Data are presented as mean ± s.e.m.
The data in a–o are representative of two independent experiments.
The statistics were obtained by one-way ANOVA coupled with Dunnett’s multiple-comparisons test ( g ) or Tukey’s multiple-comparisons test ( i–o ).
Extended Data Fig.
10 Gene expression signatures defining distinct cell clusters revealed by scRNA-seq analysis.
a , Heatmap showing top 20 DEGs across distinct cell clusters.
b–d , Violin ( b ), UMAP ( c ) and bubble plots ( d ) showing expression of selected genes across the indicated samples and clusters.
e , Histogram showing the top 20 Gene Ontology (GO) pathways enriched among upregulated DEGs between the Ki-67 + pTreg cell cluster and the pTreg cell cluster, based on Metascape analysis ( https://metascape.org ).
f , UMAP plots showing the indicated signature scores across clusters.
g , UMAP plots showing the distribution of endogenous Foxp3-GFP + CD4 + T cells from the indicated groups across distinct cell clusters.
Extended Data Fig.
11 pTregs induced by IL-2-TGF-β co-agonists in vivo exhibit effector and colonic Treg features.
a , Violin plots showing expression levels of TGF-β– (GEO, GSE264451 ), IL-2– (GEO, GSE162928 ), and STAT5-upregulated (GEO, GSE84553 ) gene sets across the indicated samples and clusters.
b–d , UMAP ( b ) and violin plots ( c and d ) showing expression levels of activated Treg (GEO, GSE149674 ) and terminal effector Treg signature gene sets across the indicated samples and clusters.
e , Violin plots showing expression levels of the colonic Treg signature gene set (ArrayExpress, E-MTAB-7311 ) across the indicated samples and clusters.
f , UMAP plot showing expression levels of the colonic Rorγt + Treg signature gene set across clusters.
The statistics were obtained by unpaired Welch’s t-test (two-tailed) ( d ).
Extended Data Fig.
12 Gene regulation and functional characterization of pTregs induced by IL-2–TGF-β co-agonists.
a–d , Therapeutic effect of TGM1–IL-2 in DSS-induced colitis (PBS, n = 9 mice; TGM1–IL-2, n = 10 mice).
a , Individual weight changes of mice in the indicated groups.
b , Representative flow cytometry plots and quantification of IFN-γ + and IL-17a + CD4 + T-cell frequencies in the colon.
c , Representative flow cytometry plots and quantification of Foxp3 + and Foxp3 - Thy1.1 + OT-II cell frequencies among total CD4 + T cells in the indicated tissues.
d , Representative flow cytometry plots and quantification of Rorγt + and Gata3 + cell frequencies among Foxp3 + OT-II cells in the indicated tissues.
e , UMAP plots showing the indicated transcription factor activity scores across clusters.
f , Venn diagram illustrating the overlap of up- and down-regulated DEGs between the indicated groups.
DEGs were filtered using an adjusted p value < 0.0001 and log 2 fold change > 1.
g , Gene regulatory networks and signature genes identified by scRNA-seq analysis.
The two numbers in parentheses represent the specific values from the Venn diagram shown in Extended Data Fig.
12f (right).
h , Schematic illustration of antigen-specific pTreg differentiation in vivo driven by TCR stimulation, TGM1–IL-2, and key transcription factors.
Created in BioRender; Sun, Q.
https://BioRender.com/2rbbpii (2026).
Data are presented as mean ± s.e.m.
The data in a–d are representative of two independent experiments.
The statistics were obtained by unpaired Welch’s t-test (two-tailed) ( b and c ).
Supplementary information (download PDF )
Reporting Summary (download PDF )
Peer Review File (download PDF )
Source Data Fig.
1 (download XLSX )
Source Data Fig.
2 (download XLSX )
Source Data Fig.
3 (download XLSX )
Source Data Fig.
4 (download XLSX )
Source Data Fig.
5 (download XLSX )
Source Data Fig.
6 (download XLSX )
Source Data Extended Data Fig.
1 (download XLSX )
Source Data Extended Data Fig.
2 (download XLSX )
Source Data Extended Data Fig.
3 (download XLSX )
Source Data Extended Data Fig.
4 (download XLSX )
Source Data Extended Data Fig.
5 (download XLSX )
Source Data Extended Data Fig.
6 (download XLSX )
Source Data Extended Data Fig.
7 (download XLSX )
Source Data Extended Data Fig.
8 (download XLSX )
Source Data Extended Data Fig.
9 (download XLSX )
Source Data Extended Data Fig.
12 (download XLSX )
Version of record : 11 March 2026
DOI : https://doi.org/10.1038/s41586-026-10208-0
Related Stories


Source: This article was originally published by Nature News
Read Full Original Article →
Comments (0)
No comments yet. Be the first to comment!
Leave a Comment