Nature ( 2026 ) Cite this article
Microbiota-dependent increase in δ-valerobetaine alters neuronal function and is responsible for age-related cognitive decline
Microbiota from young mice counteracts selective age-associated behavioral deficits
Gut metagenomes of Asian octogenarians reveal metabolic potential expansion and distinct microbial species associated with aging phenotypes
Microbiome impact on cognitive decline
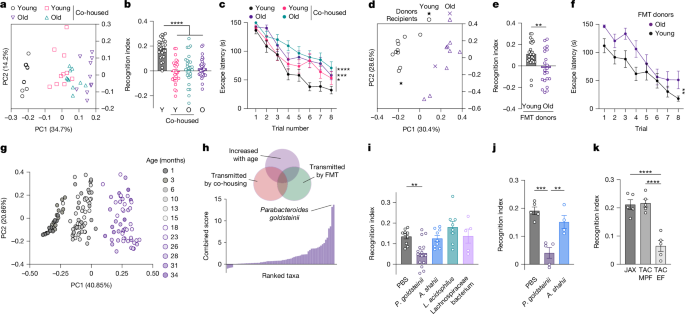
To investigate the consequences of age-associated microbiome alterations on cognitive ageing, we experimentally uncoupled the microbiome age from the host age by transferring the gut microbial community from aged mice to young recipients.
We achieved accelerated microbiome ageing in young mice by co-housing 2-month-old with 18-month-old mice, leading to an equilibration of the microbial communities between young and old mice that resembled an old-like state (Fig.
1a ).
Physical health, as assessed by frailty scoring, was unaltered by microbiome equilibration (Extended Data Fig.
1a ).
a –c , Principal coordinates analysis (PCoA) plot of microbiome dissimilarity ( a ), NOR ( b ) and Barnes maze escape latency ( c ) in young (Y, 2 months) and old (O, 18 months) mice after one month of co-housing.
d –f , PCoA plot of microbiome dissimilarity ( d ), NOR ( e ) and Barnes maze escape latency ( f ) in germ-free mice one month after faecal microbiota transfer (FMT) from young and old donors.
g , PCoA plot of metagenomic taxonomy in wild-type mice across the lifespan.
h , Identification of bacterial species increased in ageing and transferred by co-housing as well as FMT.
i – k , NOR in germ-free ( i ) or antibiotic-treated ( j ) mice colonized with the indicated species, or in mice with natural variability in P.
goldsteinii abundance ( k ).
EF, excluded flora; JAX, Jackson Laboratory; L.
acidophilus , Lactobacillus acidophilus ; MPF, murine pathogen free; PBS, phosphate-buffered saline; TAC, Taconic.
Error bars indicate mean ± s.e.m.
** P < 0.01, *** P < 0.001, **** P < 0.0001.
Exact n and P values are presented in Supplementary Table 2 .
Notably, one month of co-housing with aged mice impaired the short-term memory of young mice in the novel object recognition (NOR) task (Fig.
1b ), which was maintained during prolonged co-housing (Extended Data Fig.
1b,c ).
This phenotype was observed in both female (Fig.
1b ) and male (Extended Data Fig.
1d ) mice, and in various combinations of young and aged mice obtained from different vendors (Extended Data Fig.
1e–g ); explorative behaviour, however, was not affected by co-housing (Extended Data Fig.
1h–j ).
The impact of the aged microbiome on learning and memory was likewise observed in the Barnes maze assay—a long-term spatial learning and memory task (Fig.
1c and Extended Data Fig.
1k ).
Microbial drivers of cognitive decline
We next sought to use these experimental microbiome perturbations to identify elements of the bacterial microbiota that are involved in the regulation of cognitive decline.
We identified candidate taxa using two criteria: (1) their relative abundance increases with age, and (2) they are transmitted to young animals by co-housing and microbiome transplantation.
To characterize microbiome changes over the entire lifespan, we followed a cohort of 15 male C57BL/6 mice, longitudinally assessed health, and performed metagenomic sequencing as well as proteomics on faecal content every 2–4 months from weaning to death (Extended Data Fig.
1t ).
The cohort showed an onset of frailty and mortality at the age of two years, a mean lifespan of 955 days and a maximal lifespan of 1,210 days (Extended Data Fig.
1u,v ).
We assigned taxonomic identities to metagenomic reads using Kraken 2 (ref.
14 ).
Age was a major driver of variability in the taxonomic composition of the microbiota (Fig.
1g and Extended Data Fig.
2a ), and 1,133 species showed significant alterations in relative abundance over the lifespan (Extended Data Fig.
2b ).
The acquisition of age-associated bacterial community changes was associated with alterations in the metagenomic coding capacity of the microbiome, as determined by the change in relative abundance of KEGG orthologues over time (Extended Data Fig.
2c–e ).
We then ranked taxonomic elements according to our criteria for identifying possible drivers of cognitive decline (Fig.
1h and Supplementary Table 1 ).
The top candidate was Parabacteroides goldsteinii , whose abundance increased with age and was transmissible by co-housing and microbiota transplantation (Fig.
1h and Extended Data Fig.
2f–h ).
Stool proteomics confirmed an age-associated increase in peptides from Parabacteroides (Extended Data Fig.
2i ).
Notably, colonization of germ-free or antibiotic-treated mice with P.
goldsteinii induced cognitive impairment (Fig.
1i,j and Extended Data Fig.
2j,k ).
Furthermore, young mice from a facility with naturally high levels of P.
goldsteinii 15 showed reduced memory function (Fig.
1k and Extended Data Fig.
2l ).
Other bacteria, such as Alistipes and Lachnospiraceae, whose abundance likewise changed with age and was transmissible by co-housing (Extended Data Fig.
2m,n ), or Lactobacillus , which did not show any changes with age (Extended Data Fig.
2o ), did not impact cognitive function (Fig.
1i,j and Extended Data Fig.
2j,k ).
Collectively, these findings suggest that certain microbiome alterations over the lifespan—including the outgrowth of P.
goldsteinii — influence the rate of cognitive decline in mice.
Brain responses to microbiome ageing
Learning and memory are highly dependent on the hippocampus 16 , 17 .
We thus explored whether microbiome ageing and P.
goldsteinii outgrowth impacted hippocampal function.
Adult hippocampal neurogenesis declines with age and has been linked with learning and memory capacity 18 , 19 .
We noted a strong reduction in hippocampal neurogenesis in old mice, but co-housed young mice were not affected (Extended Data Fig.
3a,b ).
Similarly, enhanced inflammation in the hippocampus, as indicated by astrogliosis, was observed in aged mice but not transmissible to young mice by co-housing (Extended Data Fig.
3c,d ).
We also did not notice any differences in structural plasticity of dendritic spines (Extended Data Fig.
3e,f ).
These results indicate that hippocampal neurogenesis, inflammation or dendritic spine morphology are unlikely to account for the microbiome impact on learning and memory.
We thus used an unbiased RNA-sequencing-based approach to assess hippocampal molecular changes in mice with different host and microbiome ages.
We classified differentially expressed genes into four categories according to their correlation with age or cognitive performance of the host (Fig.
2a ).
Notably, immediate-early gene activation in response to novel object exposure was robustly observed in young mice but blunted in both aged groups as well as young mice co-housed with old mice (Fig.
2a,b and Extended Data Fig.
3g ).
As immediate-early gene expression is an indicator of neuronal activation, we next explored whether specific areas of the hippocampus contributed to this reduction of neuronal responses.
Staining for FOS revealed that CA3, CA1 and dentate gyrus of co-housed young mice showed impaired activation in response to novelty exposure (Fig.
2c,d ).
Furthermore, germ-free recipients of microbiota samples from young mice showed a strong increase in dentate gyrus activity in response to a novel object, but FOS responses were blunted in recipients of microbiota from old donors (Fig.
2e,f ).
The rescue of cognitive abilities in aged antibiotic-treated or germ-free mice was associated with restoration of hippocampal FOS responses to a novel object (Extended Data Fig.
3h,i ).
Conversely, colonization of young mice with the age-associated bacterial species P.
goldsteinii inhibited hippocampal responses to novel object exposure (Fig.
2g,h ).
These experiments suggest that age-associated microbiome changes impact memory function by altering neuronal responses in the hippocampus.
Fig.
2: Microbiome impact on hippocampal function.
a , Heatmap of differentially expressed hippocampal genes in singly-housed and co-housed young and aged mice.
b , Expression of hippocampal immediate-early genes.
c – h , Representative images ( c , e , g ) and quantifications ( d , f , h ) of FOS + neurons in the hippocampus of co-housed mice ( c , d ), germ-free recipients of microbiomes from young and old donors ( e , f ) and P.
goldsteinii -colonized mice ( g , h ).
Error bars indicate mean ± s.e.m.
* P < 0.05, ** P < 0.01, *** P < 0.001, **** P < 0.0001.
Scale bars, 100 μm.
Exact n and P values are presented in Supplementary Table 2 .
Source data Full size image
a , Heatmap of differentially expressed hippocampal genes in singly-housed and co-housed young and aged mice.
b , Expression of hippocampal immediate-early genes.
c – h , Representative images ( c , e , g ) and quantifications ( d , f , h ) of FOS + neurons in the hippocampus of co-housed mice ( c , d ), germ-free recipients of microbiomes from young and old donors ( e , f ) and P.
goldsteinii -colonized mice ( g , h ).
Error bars indicate mean ± s.e.m.
* P < 0.05, ** P < 0.01, *** P < 0.001, **** P < 0.0001.
Scale bars, 100 μm.
Exact n and P values are presented in Supplementary Table 2 .
Interoceptive dysfunction and memory loss
Of note, the age-associated changes in FOS responses were not unique to the hippocampus.
Several additional brain areas—including the nucleus tractus solitarii (NTS) 6 , and somatosensory and entorhinal cortices—showed reduced neuronal activation in both old and co-housed young mice (Fig.
3a,b and Extended Data Fig.
4 ).
Given the role of these areas in sensory processing, we postulated that ageing leads to reduced transduction of interoceptive information through gut-innervating sensory neurons.
We took advantage of the fact that a large fraction of both vagal and spinal afferents expresses the vanilloid receptor TRPV1 (Extended Data Fig.
5a ) and assessed the cognitive performance of Trpv1 DTA mice, which are devoid of TRPV1-expressing neurons.
Notably, young Trpv1 DTA mice showed reduced hippocampal activation and phenocopied old mice in the NOR task (Fig.
3c–e ) while retaining normal gross hippocampal architecture (Extended Data Fig.
5b ).
The same effect was observed after chemogenetic silencing of TRPV1 + neurons (Fig.
3f–h and Extended Data Fig.
5c,d ).
We thus speculated that inhibition of sensory neurons may underlie the negative impact of age-associated microbiome changes on hippocampal function.
To test this, we chemogenetically activated TRPV1 + neurons in young mice co-housed with aged mice 6 .
Remarkably, activation of sensory neurons fully restored their hippocampal FOS activity and cognitive performance, while leaving the NOR ability of young controls unaltered (Fig.
3i–k ).
A similar effect was observed with low doses of the TRPV1 agonist capsaicin, which rescued NTS activation, hippocampal responses and memory function in aged mice and co-housed young mice (Fig.
3l–p and Extended Data Fig.
5e–g ).
Capsaicin treatment was likewise able to overcome the detrimental effect of P.
goldsteinii on hippocampal memory (Fig.
3q ).
Expectedly, the beneficial effect of capsaicin on cognition was dependent on the presence of TRPV1 + neurons (Extended Data Fig.
5h ).
Fig.
3: Impaired gut–brain signalling drives cognitive deficits.
a , b , FOS responses in the NTS of singly-housed and co-housed young and aged mice.
c – t , Representative images of FOS + hippocampal neurons ( c , f , i , l , r ), FOS quantifications ( d , g , j , m , o , s ) and NOR ( e , h , k , n , p , q , t ) in Trpv1 DTA mice ( c – e ); Trpv1 AAV-hM4Di mice ( f – h ); co-housed Trpv1 AAV-hM3Dq mice ( i – k ); capsaicin-treated young and old mice ( l – n ); capsaicin-treated co-housed young and old mice ( o , p ); P.
goldsteinii -colonized mice ( q ); and Trpv1-Cre/Phox2b-FlpO hM4Di mice ( r – t ).
u – y , Schematic of in vivo calcium imaging of nodose ganglia in response to duodenal Ensure infusion ( u ) and heatmaps ( v ), quantification of responsive neurons ( w ), z -scores over time ( x ) and mean responses ( y ) of vagal neurons in young mice and young mice co-housed with aged mice.
Arrow indicates start of Ensure infusion.
CNO, clozapine- N -oxide.
Error bars indicate mean ± s.e.m.
Scale bars, 100 μm.
NS, not significant; * P < 0.05, ** P < 0.01, *** P < 0.001, **** P < 0.0001.
Exact n and P values are presented in Supplementary Table 2 .
Image in u created in BioRender; T, C.
https://biorender.com/s2mmfpa (2026).
Source data Full size image
a , b , FOS responses in the NTS of singly-housed and co-housed young and aged mice.
c – t , Representative images of FOS + hippocampal neurons ( c , f , i , l , r ), FOS quantifications ( d , g , j , m , o , s ) and NOR ( e , h , k , n , p , q , t ) in Trpv1 DTA mice ( c – e ); Trpv1 AAV-hM4Di mice ( f – h ); co-housed Trpv1 AAV-hM3Dq mice ( i – k ); capsaicin-treated young and old mice ( l – n ); capsaicin-treated co-housed young and old mice ( o , p ); P.
goldsteinii -colonized mice ( q ); and Trpv1-Cre/Phox2b-FlpO hM4Di mice ( r – t ).
u – y , Schematic of in vivo calcium imaging of nodose ganglia in response to duodenal Ensure infusion ( u ) and heatmaps ( v ), quantification of responsive neurons ( w ), z -scores over time ( x ) and mean responses ( y ) of vagal neurons in young mice and young mice co-housed with aged mice.
Arrow indicates start of Ensure infusion.
CNO, clozapine- N -oxide.
Error bars indicate mean ± s.e.m.
Scale bars, 100 μm.
NS, not significant; * P < 0.05, ** P < 0.01, *** P < 0.001, **** P < 0.0001.
Exact n and P values are presented in Supplementary Table 2 .
Image in u created in BioRender; T, C.
https://biorender.com/s2mmfpa (2026).
Vagal PHOX2B + TRPV1 + neurons are composed of several neuronal subsets 22 , 23 , including gut-innervating neurons expressing the cholecystokinin A receptor ( Cckar ) (Extended Data Fig.
5a ).
We found that ablation of CCKAR + neurons by nodose injection of the cholecystokinin-conjugated neurotoxin saporin 24 , 25 , 26 (CCK-SAP; Extended Data Fig.
6d ) impaired cognitive performance (Extended Data Fig.
6e ), in line with past observations in rats 26 .
As CCKAR + neurons respond to intestinal CCK peptide 27 and transmit information between the gut and hippocampus 28 , 29 , we sought to determine whether CCK stimulation of vagal afferents is sufficient to restore cognitive performance in aged mice.
Notably, after peripheral administration of CCK, the cognitive performance of aged mice and co-housed young mice was indistinguishable from that of control young mice, and hippocampal FOS responses were restored (Extended Data Fig.
6f–k ).
As CCK not only acts as a gastrointestinal vagal activator but also exerts hormonal effects on other tissues 30 , we determined whether its memory-enhancing effect depended on sensory neurons.
Denervated Trpv1 DTA mice were unresponsive to CCK administration (Extended Data Fig.
6l ), suggesting that sensory neurons are necessary for the effect of CCK on hippocampal function.
The same effect was achieved with glucagon-like peptide 1 (GLP1)—another intestinal peptide that stimulates the vagus nerve (Extended Data Fig.
6m,n ).
Consistently, the GLP1 receptor agonist liraglutide enhanced memory function in aged mice (Extended Data Fig.
6o ).
Although these gut peptides were able to restore cognitive function, their endogenous levels were unchanged during ageing and P.
goldsteinii colonization (Extended Data Fig.
6p–s ).
Furthermore, the CCKAR inhibitors devazepide and A-65186 did not induce cognitive deficits (Extended Data Fig.
6t,u ), suggesting that reduced gut hormone levels do not account for the age-associated interoceptive dysfunction that drives cognitive decline.
Gut metabolites and cognitive decline
Fig.
4: MCFA signalling through GPR84 drives memory loss.
a , Schematic of workflow.
b , NOR in mice receiving filtered supernatants from P.
goldsteinii and A.
shahii cultures via oral gavage.
c , Volcano plot of metabolites from P.
goldsteinii and A.
shahii cultures.
d – g , Representative images of FOS + dentate gyrus neurons ( d ), FOS quantifications ( e ) and NOR ( f , g ) in mice treated with 3-HOA ( d – f ), or with decanoic or dodecanoic acid ( g ).
h – k , In vivo calcium imaging of nodose ganglia in response to duodenal Ensure infusion of mice treated with decanoic acid, shown as heatmaps ( h ), z -scores over time ( i ), mean responses ( j ) and peak responses ( k ).
Arrow indicates start of Ensure infusion.
l , m , Representative images ( l ) and quantification of FOS + neurons ( m ) in the NTS of decanoic acid-treated mice and controls.
n – y , Representative images of FOS + dentate gyrus neurons ( n , p , s , v ), FOS quantifications ( o , q , t , w ) and NOR ( r , u , x , y ) in: wild-type ( n , o ) or Gpr84 − / − mice treated with decanoic acid ( p – r ); mice given embelin, 3-HOA, PBI-4050 or capsaicin ( s – w ); P.
goldsteinii -colonized mice treated with PBI-4050 ( x ); or old mice treated with PBI-4050 ( y ).
Error bars indicate mean ± s.e.m.
Scale bars, 100 μm.
* P < 0.05, ** P < 0.01, **** P < 0.0001.
Exact n and P values are presented in Supplementary Table 2 .
Images in a created in BioRender; T, C.
https://biorender.com/p6614lw (2026).
Source data Full size image
a , Schematic of workflow.
b , NOR in mice receiving filtered supernatants from P.
goldsteinii and A.
shahii cultures via oral gavage.
c , Volcano plot of metabolites from P.
goldsteinii and A.
shahii cultures.
d – g , Representative images of FOS + dentate gyrus neurons ( d ), FOS quantifications ( e ) and NOR ( f , g ) in mice treated with 3-HOA ( d – f ), or with decanoic or dodecanoic acid ( g ).
h – k , In vivo calcium imaging of nodose ganglia in response to duodenal Ensure infusion of mice treated with decanoic acid, shown as heatmaps ( h ), z -scores over time ( i ), mean responses ( j ) and peak responses ( k ).
Arrow indicates start of Ensure infusion.
l , m , Representative images ( l ) and quantification of FOS + neurons ( m ) in the NTS of decanoic acid-treated mice and controls.
n – y , Representative images of FOS + dentate gyrus neurons ( n , p , s , v ), FOS quantifications ( o , q , t , w ) and NOR ( r , u , x , y ) in: wild-type ( n , o ) or Gpr84 − / − mice treated with decanoic acid ( p – r ); mice given embelin, 3-HOA, PBI-4050 or capsaicin ( s – w ); P.
goldsteinii -colonized mice treated with PBI-4050 ( x ); or old mice treated with PBI-4050 ( y ).
Error bars indicate mean ± s.e.m.
Scale bars, 100 μm.
* P < 0.05, ** P < 0.01, **** P < 0.0001.
Exact n and P values are presented in Supplementary Table 2 .
Images in a created in BioRender; T, C.
https://biorender.com/p6614lw (2026).
Gut inflammation and vagal dysfunction
The expression of GPR84 is largely confined to myeloid cells 37 .
Indeed, in a single-cell survey of intestinal immune cells 38 , we found that Gpr84 was only expressed by macrophages, monocytes and neutrophils (Fig.
5a and Extended Data Fig.
8e,f ).
We thus tested a possible involvement of myeloid cells in microbiome- and MCFA-induced cognitive ageing.
Of note, the CSF1R inhibitor PLX-3397, which depletes myeloid cells, restored cognitive function both in the co-housing setting and after 3-HOA administration (Fig.
5b,c ).
As CSF1R inhibition ablates myeloid cells both centrally and peripherally 39 (Extended Data Fig.
8g,h ), we sought to use orthogonal strategies to target peripheral macrophages while sparing microglia in the brain.
Importantly, clodronate liposomes, which deplete phagocytic cells but do not cross the blood–brain barrier (Extended Data Fig.
8i,j ), likewise rescued the detrimental effect of 3-HOA on NOR (Fig.
5d ).
Similarly, mice with a genetic deficiency in CCR2, which leads to impaired recruitment of myeloid cells to peripheral tissues but not the brain 40 (Extended Data Fig.
8k–n ), were equally resistant to the effect of 3-HOA (Fig.
5e ).
Myeloid cell ablation improved the response of vagal neurons to nutrient stimulation (Fig.
5f–h ), and hippocampal responses to novelty exposure (Fig.
5i,j ).
Fig.
5: GPR84 signalling on peripheral myeloid cells drives cognitive decline through inflammatory activation.
a , Uniform manifold approximation and projection (UMAP) of single-cell transcriptomes of colonic CD45 + cells highlighting Gpr84 expression.
b , c , NOR in co-housed ( b ) and 3-HOA-treated ( c ) mice receiving PLX3397.
d , e , NOR in 3-HOA-treated mice receiving clodronate liposomes ( d ) or with Ccr2 deficiency ( e ).
f – h , In vivo calcium imaging of nodose ganglia in response to duodenal Ensure infusion of decanoic acid-treated mice receiving PLX3397, shown as heatmaps ( f ), z -scores over time ( g ) and peak responses ( h ).
Arrow indicates start of Ensure infusion.
i , j , Representative images of FOS + dentate gyrus neurons ( i ), and FOS quantification ( j ) in 3-HOA-treated mice receiving clodronate liposomes or with Ccr2 deficiency.
KO, knockout.
k – n , Schematic ( k , m ) and NOR ( l , n ) of decanoic-acid-treated wild-type (WT) mice harbouring bone marrow transplants from Gpr84 − / − ( k , l ) or 50/50 mixed Gpr84 −/− / Ccr2 −/− mice ( m , n ).
o , p , NOR in co-housed ( o ) and 3-HOA-treated ( p ) mice receiving anti-TNF antibody.
q , NOR in co-housed mice receiving anti-IL-1β antibody.
r , NOR in Nlrp3 −/− mice treated with 3-HOA.
s , NOR in Phox2b Cre - Il1r1 fl/fl mice treated with decanoic acid.
t , NOR in Trpv1 AAV-hM3Dq mice treated with IL-1β and CNO.
Error bars indicate mean ± s.e.m.
Scale bar, 100 μm.
* P < 0.05, ** P < 0.01, *** P < 0.001, **** P < 0.0001.
Exact n and P values are presented in Supplementary Table 2 .
Images in k and m created in BioRender; T, C.
https://biorender.com/lbleqjs (2026).
Source data Full size image
a , Uniform manifold approximation and projection (UMAP) of single-cell transcriptomes of colonic CD45 + cells highlighting Gpr84 expression.
b , c , NOR in co-housed ( b ) and 3-HOA-treated ( c ) mice receiving PLX3397.
d , e , NOR in 3-HOA-treated mice receiving clodronate liposomes ( d ) or with Ccr2 deficiency ( e ).
f – h , In vivo calcium imaging of nodose ganglia in response to duodenal Ensure infusion of decanoic acid-treated mice receiving PLX3397, shown as heatmaps ( f ), z -scores over time ( g ) and peak responses ( h ).
Arrow indicates start of Ensure infusion.
i , j , Representative images of FOS + dentate gyrus neurons ( i ), and FOS quantification ( j ) in 3-HOA-treated mice receiving clodronate liposomes or with Ccr2 deficiency.
KO, knockout.
k – n , Schematic ( k , m ) and NOR ( l , n ) of decanoic-acid-treated wild-type (WT) mice harbouring bone marrow transplants from Gpr84 − / − ( k , l ) or 50/50 mixed Gpr84 −/− / Ccr2 −/− mice ( m , n ).
o , p , NOR in co-housed ( o ) and 3-HOA-treated ( p ) mice receiving anti-TNF antibody.
q , NOR in co-housed mice receiving anti-IL-1β antibody.
r , NOR in Nlrp3 −/− mice treated with 3-HOA.
s , NOR in Phox2b Cre - Il1r1 fl/fl mice treated with decanoic acid.
t , NOR in Trpv1 AAV-hM3Dq mice treated with IL-1β and CNO.
Error bars indicate mean ± s.e.m.
Scale bar, 100 μm.
* P < 0.05, ** P < 0.01, *** P < 0.001, **** P < 0.0001.
Exact n and P values are presented in Supplementary Table 2 .
Images in k and m created in BioRender; T, C.
https://biorender.com/lbleqjs (2026).
To directly test whether the effect of GPR84 was mediated by myeloid cells, we generated bone marrow chimeras, in which we reconstituted irradiated recipient mice with bone marrow from either wild-type or GPR84-deficient mice, verified efficient engraftment and then treated the recipients with MCFA (Fig.
5k and Extended Data Fig.
8o,p ).
In these mice, cognitive function was only retained when GPR84 was lacking from the haematopoietic compartment (Fig.
5l ).
To increase specificity for myeloid cells, we used mixed bone marrow chimeras, in which we reconstituted irradiated recipients with a 50:50 mixture of GPR84- and CCR2-deficient bone marrow (Fig.
5m ).
In these mice, peripheral myeloid cells selectively lack GPR84 expression (Extended Data Fig.
8q ), and their cognitive performance was intact despite MCFA treatment (Fig.
5n ).
The depletion of other immune cell types did not impact performance in the NOR task (Extended Data Fig.
9a–h ).
These findings highlight an important role for GPR84 on peripheral myeloid cells in driving the impact of MCFAs on cognitive ageing.
GPR84 signalling triggers the production of pro-inflammatory cytokines, such as tumour necrosis factor (TNF) and interleukin-1β (IL-1β) (refs.
41 , 42 ; Extended Data Fig.
9i ).
We noticed that acquisition of an aged microbiome led to increased expression of inflammatory cytokines locally in the gastrointestinal tract as well as in adipose tissue, but not systemic sites nor the brain (Extended Data Fig.
9j–m ).
We hypothesized that the lipophilic nature of MCFAs may lead to their preferential accumulation in adipose tissue 43 , and that mesenteric adipose tissue might be a source of inflammatory cytokines in the gastrointestinal tract.
Indeed, in mice treated with MCFAs, we observed an increased concentration within adipose tissue, as well as elevated cytokine expression in both mesenteric and inguinal adipose tissue (Extended Data Fig.
10a–c ).
This was also seen in aged C57BL/6 but not aged DBA/2 mice (Extended Data Fig.
10d–f ), indicating that GPR84 might be involved in driving age-associated inflammation in response to MCFA accumulation.
Finally, we sought to determine the functional relevance of peripheral inflammatory cytokines for memory loss.
We first confirmed that administration of either TNF or IL-1β was sufficient to impair cognitive function (Extended Data Fig.
10g,h ).
This effect was rescued by CCK treatment (Extended Data Fig.
10g ), indicating that vagal activation was able to restore cognitive performance despite ongoing inflammatory responses.
Second, a TNF-neutralizing antibody rescued memory function in aged mice as well as co-housed young mice and protected against the detrimental effect of 3-HOA supplementation (Fig.
5o,p ).
Similarly, IL-1β neutralization protected aged and co-housed young mice (Fig.
5q ).
Furthermore, deficiency in NLRP3—a GPR84-induced inflammasome component required for proteolytic processing of IL-1β (refs.
41 , 44 )—likewise conferred resistance against the cognitive impact of 3-HOA treatment (Fig.
5r ).
We also investigated the cellular targets of TNF and IL-1β that contribute to cognitive decline.
Although TNF receptor expression was predominantly required on haematopoietic cells (Extended Data Fig.
10i ), deletion of the receptor of IL-1β on PHOX2B-expressing cells counteracted the effect of MCFAs on memory function (Fig.
5s ), suggesting that IL-1β signalling on vagal sensory neurons impaired their function.
Consistently, chemogenetic reactivation of sensory neurons protected mice from the detrimental effect of IL-1β on memory (Fig.
5t ).
Altogether, our findings suggest a model whereby ageing leads to changes in the gastrointestinal milieu, including the outgrowth of P.
goldsteinii and accumulation of MCFAs.
These metabolites, in turn, drive pro-inflammatory myeloid cell responses through GPR84 signalling, thereby impairing vagal activity, hippocampal responses and memory function (Extended Data Fig.
10j ).
Memory loss is one of the most devastating aspects of ageing, with no effective treatments available.
Here we have defined a pathway linking intestinal P.
goldsteinii , MCFAs, myeloid cell GPR84 signalling, cytokines TNF and IL-1β, vagal dysfunction and reduced hippocampal novelty responses, which contributes to declining memory function during ageing.
Our results provide several conceptual advances.
Brain ageing has a large brain-extrinsic component.
Although several examples of humoral factors involved in the regulation of brain ageing have been defined 45 , 46 , less is known about the neuronal body–brain signals that contribute to the decline in brain function.
Our study suggests that interoceptive routes of communication between the gut and the brain may lose their function over the course of the lifespan, with reduced sensory input into the brain contributing to aspects of brain ageing.
Thus, interoceptive dysfunction might constitute a common principle underlying several diseases of the ageing brain.
Finally, although interactions between myeloid cells and neurons in the brain are critical in the context of cognitive decline, our data suggest that inflammatory processes do not necessarily need to take place in the central nervous system to affect cognitive function.
Thus, a local inflammatory milieu in a peripheral tissue, such as the gastrointestinal tract, might be sufficient to trigger sensory neuron dysfunction and cognitive sequelae even in the absence of a generally heightened inflammatory response detected in the blood or brain.
These open questions notwithstanding, our findings emphasize the importance of body-derived signals in cognition and highlight the ability of the interoceptive system to counteract age-associated decline in hippocampal function and short-term memory.
Pharmacological activators of interoceptive pathways—which we refer to as interoceptomimetics 59 —may thus have the potential to stimulate sensory input into the brain to boost the formation of memory engrams in the hippocampus.
Our findings call for the systematic exploration of possible interoceptomimetics and their impact on the ageing brain.
Unless noted otherwise, young female (8 weeks old) and male (4 weeks old) C57BL/6 mice were obtained from The Jackson Laboratory and old mice (18 months old) were acquired from the National Institute on Aging.
For co-housing, mice were housed either two young + three old, or three young + two old per cage.
Males were co-housed before puberty to avoid fighting.
Non-co-housed control young and old mice had their cages mixed so that two mice were swapped between each cage to control for the social effect of cage mixing.
Where possible, mice were randomized to experimental groups, and experimenters were blinded to the experimental condition.
Animals were housed in facilities at the University of Pennsylvania, the Arc Institute or Stanford University in 7 am to 7 pm light–dark cycles, 20–25 °C and 30–70% humidity.
All experimental procedures were performed according to approval by the IACUC committees at the University of Pennsylvania, Stanford University and the Arc Institute.
Germ-free C57BL/6 mice were maintained in sterile isolators at the University of Pennsylvania Gnotobiotic Animal Facility.
For FMT, one stool pellet per recipient mouse was homogenized in 1.5 ml of sterile phosphate-buffered saline (PBS) in an anaerobic hood and filtered through 70 μm filters.
This homogenate (200 μl) was orally gavaged into germ-free mice housed in positive pressure isocages; in addition to oral gavage, 50 ml of used bedding from donor cages was added to the isocages.
The following mouse strains were used in manuscript and were purchased from The Jackson Laboratory: C57BL/6J (000664), CD45.1 (002014), DBA/2J (000671), Trpv1 Cre (017769), Snap25-GCaMP6s (025111), DTA (009669), Phox2b Cre (016223), Phox2b FlpO (022407), Il1r fl/fl (028398), Ccr2 −/− (004999), Nlrp3 −/− (021302), Tnfr −/− (003243), Cre-dependent hM4Di (026219), Cre/FlpO-dependent hM4Di (029040) and Ai65 (Cre/FlpO-dependent tdTomato) (021875).
Gpr84 −/− mice were a kind gift from I.
Kimura 60 .
Antibiotic treatment, bacterial colonization and stool collection
Mice were given a combination of neomycin (1 g l –1 ; Research Products International); ampicillin (1 g l –1 ; Research Products International); vancomycin (0.5 g l –1 ; Mylan); metronidazole (0.5 g l –1 ; Research Products International); imipenem or cilastatin (0.5 g l –1 ; Fresenius Kabi); and ciprofloxacin (0.2 g l –1 ; Sigma-Aldrich) in their drinking water for two weeks.
Parabacteroides goldsteinii (ATCC) and Alistipes shahii (ATCC) were grown under anaerobic conditions at 37 °C in Tryptic Soy Broth (BD Biosciences) supplemented with 5% defibrinated sheep’s blood (Hardy Diagnostics).
Lachnospiraceae bacterium (DSMZ) was grown under anaerobic conditions at 37 °C in fastidious anaerobe broth (FAB) (Neogen).
Lactobacillus acidophilus (ATCC) and Escherichia coli K12 (ATCC) were grown under aerobic conditions according to supplier instructions.
Bacteria were gavaged into mice after two weeks of antibiotics treatment 24 h after the cessation of treatment.
Mice were gavaged every other day the first week, and then once a week after.
Control mice received PBS gavage.
Stool samples for all experiments were collected fresh in 1.7 ml Eppendorf tubes and immediately snap frozen on dry ice before storage at −80 °C until DNA extraction.
P.
goldsteinii and A.
shahii were grown for two days in 50 ml tubes before centrifugation for 20 min at 3,220 × g at 4 °C.
The supernatant was sterilized through 0.45 μm filters before 30 min of centrifugation through a 3 kDa size filter (Thermo Fisher Scientific) at 3,220 × g at 4 °C.
The <3 kDa fraction was then treated with 25 μg ml –1 proteinase K (Thermo Fisher Scientific) for 1 h at 37 °C and then boiled for 10 min at 99 °C.
This solution (300 μl) was gavaged into mice for five days before testing 1 h after the final gavage.
Mice received 50 mg kg –1 bromodeoxyuridine (BrdU) (MedChem Express) dissolved in sterile PBS via intraperitoneal injection for five consecutive days, brains were collected four weeks after final injection.
Capsaicin, cholecystokinin, GLP1 agonist and CCKAR antagonist treatment
Capsaicin (Sigma-Aldrich) was dissolved at 25 mg ml –1 in 10% Tween-80, 10% ethanol and 80% PBS.
Mice were intraperitoneally injected with 5 μg kg –1 capsaicin for five days before testing.
Cholecystokinin octapeptide (2 μg kg –1 CCK; Bachem), GLP1 (amino acid positions 7–36) (4 mg kg –1 , Cayman Chemical, 15069) and liraglutide (1 mg kg –1 ; Toronto Research Chemicals) were dissolved in PBS and injected 1 h before testing.
The CCKAR receptor antagonists devazepide (MedChem Express) and A-65186 (Biorbyt) were dissolved in 10%:10% DMSO:Tween-80 in PBS and injected intraperitoneally for five days at 1 mg kg –1 before testing.
MCFA, embelin and PBI-4050 treatment
3-HOA (100 mg kg –1 ; 1PlusChem), embelin (100 mg kg –1 ; Ambeed), decanoic acid (20 mg kg –1 ; Sigma-Aldrich) and PBI-4050 (20 mg kg –1 ; TargetMol) were dissolved in 5% DMSO, 5% Tween-80 and 90% PBS.
An oral gavage was conducted for five days, with 1 h after the final treatment.
For water supplementation, decanoic and dodecanoic acid (Sigma-Aldrich) were dissolved at 100 mg ml –1 in Tween-80 and then added to drinking water at 0.2 mg ml –1 for ten days; daily water consumption was assumed to be 3 ml per mouse.
All antibodies were obtained from BioXCell.
For cytokine depletion, mice received intraperitoneal injections of anti-TNF (150 μg, BP0058) or anti-IL-1β (50 μg, BE0246) on days 0, 4 and 7 before testing on day 8.
For T cell depletion, mice received 200 μg intraperitoneal injections of anti-CD4 (BE0003) on days 0 and 4 and 200 μg anti-CD8α intraperitoneally (BE0061) on day 0 before testing on day 7.
For natural killer cell depletion, mice received 200 μg intraperitoneal injections of anti-NK1.1 (BE0036) on days 0 and 4 before testing on day 7.
For neutrophil depletion, mice received daily intraperitoneal injections of anti-Ly6G (25 μg, BP0075-1) and anti-rat immunoglobulin G (50 μg, BE0122) every other day for one week before testing 61 .
PLX-3397 (Selleck Chemicals, S7818) was formulated in AIN-76A (Research Diets) at 290 mg kg –1 and fed to mice for ten days before testing.
Control and clodronate liposomes (Liposoma) were injected at 10 mg kg –1 equivalent of clodronate dose on days 0 and 3.
Treatment with 3-HOA started on day 1; mice were tested on day 5 and tissues were collected on day 6.
Recombinant TNF and IL-1β treatment
TNF or IL-1β (1 μg; PeproTech) dissolved in PBS was injected intraperitoneally once daily for five days, with testing performed 1 h after the final injection.
In vivo 2-photon nodose ganglia imaging
In vivo imaging was conducted using a two-photon microscope (Bruker) equipped with a galvanometer for image acquisition and a piezo objective combined with a galvo/resonant scanner, allowing image capture at 29 frames per second.
The set-up included a Somnosuite anaesthesia system (Kent Scientific) for isoflurane delivery, a homoeothermic control warming pad to maintain body temperature and a programmable syringe pump (Harvard Apparatus PHD 2000) for nutrient infusions into the intestine.
Imaging was performed using a 20× water-immersion upright objective.
The surgical procedure followed a previously described protocol 29 .
Snap25-GCaMP6s mice were fasted for 1 h before the onset of the dark cycle.
Mice were placed under continuous anaesthesia (isoflurane/oxygen) and maintained on a heating pad throughout the procedure.
At least one hour after the onset of the dark cycle, an approximately 2-cm incision was made above the sternum and below the jaw to expose the carotid artery and vagus nerve by separating the salivary glands.
Retractors were used to pull the sternomastoid, omohyoid and posterior belly of the digastric muscles aside, allowing visualization of the nodose ganglion.
The vagus nerve was transected above the nodose ganglion, which was carefully separated from the hypoglossal nerve and small adjacent branches.
The vagus nerve was then dissected away from the carotid artery and surrounding tissues.
The right nodose ganglion was gently positioned onto a stable imaging platform consisting of a 5 mm diameter coverslip attached to a metal arm with a magnetic base.
Surgical silicone adhesive (Kwik-Sil, WPI) was applied to secure the vagus nerve in place, and the ganglion—immersed in DMEM (Corning)—was covered with a second coverslip before imaging.
To deliver nutrients into the intestine, a small abdominal incision was made in the anaesthetized mouse to expose the stomach.
Silicone tubing was inserted through a small incision in the stomach wall and advanced into the proximal duodenal lumen.
Super glue was applied to secure the tubing to the stomach wall and prevent it from sliding out.
Infusions were delivered using a precision pump connected to syringes filled with Ensure and attached to the silicone tubing.
Baseline neuronal activity was recorded for 30 s, followed by a 30 s of continuous infusion of 200 µl of Ensure, and an additional 90 s of post-infusion recording.
In certain experiments, the surgery followed treatment with either vehicle (Tween-80) or decanoic acid 0.2 mg ml –1 in drinking water for one week before recording.
In experiments using PLX diet, decanoic acid and PLX were administered concurrently for one week.
GCaMP6s fluorescence changes were analysed by outlining regions of interest (ROIs) corresponding to individual neurons throughout the imaging session.
Pixel intensities within ROIs (averaged across pixels) were measured frame-by-frame using ImageJ, and the data were exported to Excel for further analysis.
The z -score for each neuron was calculated as follows: the mean baseline fluorescence (over a 30-s period) was subtracted from the fluorescence intensity at each time point, and the result was divided by the standard deviation of the baseline fluorescence.
This normalization quantified fluorescence changes as the number of standard deviations above baseline.
Neurons were classified as responsive if they met the following criteria: (1) peak GCaMP6s fluorescence reached a z -score of ≥2.5, and (2) mean GCaMP6s fluorescence was more than 2.5 above the baseline mean for at least five consecutive seconds during or after infusion.
Nodose ganglion neurons that displayed no baseline activity were excluded from the analysis.
CCK–SAP nodose ganglia injection
Coeliac–superior mesenteric ganglionectomy
To determine splanchnic contributions to gut–brain sensing, splanchnic afferents underwent a gangliectomy at the prevertebral coeliac and superior mesenteric ganglia.
Mice were anaesthetized and treated with analgesia and an abdominal midline incision was made through skin and muscle.
The coeliac and superior mesenteric arteries were exposed by targeting the aorta at the arterial branching point medial to the left kidney.
At the intersection of the three blood vessels, coeliac and superior mesenteric ganglia and the surrounding tissue were gently teased away until the area between was cleared of nerve and lymphatic tissue.
In sham animals, the area was exposed, and a small tear was made in the lymphatic tissue, but the ganglia were left intact.
Mice were given at least one week to recover and regain presurgical weight.
Dorsal root ganglia ablation and hot plate testing
Resiniferatoxin (RTX; AdipoGen) was dissolved in PBS with 0.25% DMSO/0.02% Tween-80/0.05% ascorbic acid and 50 ng RTX in 10 μl was injected intrathecally at L5–L6 into four-week-old male wild-type mice under isoflurane anaesthesia 62 .
Mice were tested four weeks after injection, and ablation was confirmed by hot-plate testing, where mice were placed on a 56 °C plate and latency to paw licking was timed with a maximum of 30 s.
Sex-matched CD45.1 mice received two 550 cGy doses of irradiation spread 4 h apart and received one million live bone marrow cells 24 h after the first irradiation.
For mixed chimeras, mice received a 50:50 mix of either wild-type or Gpr84 −/− bone marrow combined with Ccr2 −/− bone marrow.
Mice were tested six weeks after transplantation.
Intestinal barrier permeability testing
Fluorescein isothiocyanate-dextran (3 kDa; Sigma-Aldrich) was dissolved in PBS to a concentration of 80 mg l –1 .
Mice were fasted for 4 h before being subjected to gavage with 150 μl, and blood was centrifuged at 10,000 × g for 5 min at 4 °C.
Serum was collected and fluorescence was quantified at an excitation wavelength of 485 nm and emission wavelength of 535 nm.
A four-week-old Trpv1 Cre Phox2b FlpO tdTomato mouse was fasted for 24 h to reduce luminal gut content, euthanized and then perfused with 25 ml cold PBS followed by 25 ml cold 4% paraformaldehyde (PFA); the mouse was then post-fixed in 4% PFA at 4 °C for 24 h.
The skin was then removed and the mice were further processed by LifeCanvas Technologies.
Briefly, the body was decalcified in 10% EDTA at 4 °C for ten days, refreshing the solution every two days before SHIELD fixation (six days SHIELD OFF at 4 °C followed by 24 h SHIELD ON at 37 °C).
Delipidation buffer was then applied at 45 °C for ten days before organic solvent delipidation with a THF/PBS-Quadrol (25% Quadrol in PBS) dehydration gradient.
Dehydration was performed at 4 °C with 50%, 70%, 80%, 90% and 95% THF solutions, for 24 h per step.
The sample was then moved to dichloromethane for five days, refreshing daily.
After that the sample was rehydrated following the reverse gradient and washed in PBS for three days.
The sample was then index matched in 50% EasyIndex for three days, before being moved to 100% EasyIndex and index matched for a further three days, mounted and then imaged after removing the paws.
Imaging was performed on a SmartSPIM microscope with a 1.625× objective using a 4 μm z -step.
CCK (Abbexa) and GLP1 (EMD Millipore) ELISA kits were used according to manufacturer’s instructions.
Mice were fasted for 24 h, and tissue and serum were collected 45 min after refeeding.
Tissue samples were homogenized in RIPA buffer (Cell Signalling Technology) with protease inhibitors (Sigma-Aldrich).
Monocytes were extracted from whole blood using a mouse monocyte isolation kit according to manufacturer’s instructions (Biolegend).
Isolation of intestinal leukocytes
The intestinal lumen was flushed with cold PBS, opened longitudinally and cut into 1 cm pieces.
Epithelial cells were removed by incubating in dissociation buffer (3% foetal bovine serum (FBS) (Corning) and 10 mM EDTA in Hank’s balanced salt solution) at 4 °C with shaking for 30 min.
After removing epithelial cells by vortexing and straining through a 70-μm filter, the remaining intestinal pieces were washed thoroughly in cold PBS and then digested in Hank’s balanced salt solution containing 0.1 mg ml –1 Liberase (Sigma-Aldrich) and 1 mg ml –1 DNase (ROC) for 20 min at 37 °C, with shaking at a rate of 180 r.p.m.
The digested cells were washed with PBS and passed through a 70 μm cell strainer.
Intestinal (as described above) or blood leukocytes were collected; blood leukocytes were collected via cardiac puncture and red blood cells lysed with ACK lysing buffer (Quality Biological).
Cell viability staining was performed using the LIVE/DEAD Fixable Aqua Cell Stain Kit (Thermo Fisher Scientific; 1:500); blocking with TruStain FcX PLUS (BioLegend; 1:50) for 30 min at 4 °C.
Staining was performed with BioLegend antibodies at 1:100 dilution against CD45, CD45.1, CD45.2, TCRβ, CD4, CD8a and NK1.1 for 15 min at 4 °C.
All samples were acquired by flow cytometry (LSR II, BD Biosciences) and analysed using the FlowJo software (Tree Star).
DREADD adenovirus and clozapine- N -oxide injection
Viral genomes (1 × 10 11 ) of either AAV9-PHP.S.hSyn.DIO.hM3D(Gq)-mCherry.WPRE.hGH (Addgene) or AAV9-PHP.S.hSyn.DIO.hM4D(Gi)-mCherry.WPRE.hGH (Addgene) were diluted in PBS and injected retro-orbitally into heterozygous Trpv1 Cre mice 63 , 64 .
Testing was performed 3–4 weeks after injection.
Baseline performance was established 1 h after intraperitoneal injection of vehicle (0.1% DMSO in sterile PBS).
Mice were then tested 1 h after injection of CNO (Cayman Chemical Company) at 1 mg kg –1 .
Phox2b hM4Di mice were injected once daily for five days with 0.5 mg kg –1 CNO and tested 3 h after injection.
Frailty in young and old mice at baseline and after co-housing was assessed using an established 25-item frailty index 65 .
Elmer’s 22 g glue sticks and 5 cm binder clips (Amazon ASIN).
100 ml glass bottle (Sari-Glas) filled with 100 ml water and plastic funnel (Thermo Fisher Scientific).
A custom-made 2.5 cm square aluminium block, 15 cm tall on 5 cm × 5 cm clear plastic base, and 2.5 cm diameter white PVC cylinder, 15 cm tall on 5 cm × 5 cm clear plastic base.
The recognition index was calculated as follows: (novel object time (s) – 15 s)/30 s.
Mice were placed in the maze (San Diego Instruments) opposite the escape hole and allowed to explore for up to 2.5 min.
After each trial, if the mouse did not find the escape hole, it was gently guided to it and allowed to stay there for 15 s.
Mice were tested twice a day, 1 h apart, for four consecutive days.
Tracking and analysis were conducted using the Ethovision software v.15 (Noldus).
Mice were handled one day before testing and acclimatized to the room for 30 min before testing from 8 pm to 10 pm.
Mice were placed into a 40 × 40 cm box and allowed to explore for 15 min.
Tracking and analysis were conducted using the EthoVision software v.15 (Noldus).
Stool DNA was purified using DNeasy PowerSoil Pro Kit (Qiagen) according to manufacturer’s instructions.
For the longitudinal C57BL/6J cohort, DNeasy PowerSoil Kit (Qiagen) was used.
Metagenomic library preparation and analysis
Libraries from longitudinal samples over the lifespan were prepared with DNA extract from stool using the Illumina Nextera DNA Flex Library Prep kit (Illumina) with TruSeq unique dual indices (Illumina) according to manufacturer’s instructions.
Quality and quantity control of DNA and libraries were performed using an Agilent 4200 TapeStation and Qubit 4, respectively.
Sequencing was performed on a NextSeq 550 instrument using a 75-cycle kit (Illumina).
Demultiplexing was performed using the illumina Bcl2fastq software (v.2.20.0.422).
Reads processing was performed using the snakemake Sunbeam pipeline (v.2.1.1 + dev81.gd0e29cd) 67 .
Briefly, reads were trimmed for minimal length of 36-base pairs using Trimmomatic (v.0.39).
Adapter sequences were removed.
Reads with a sequence complexity score lower than 0.55 were removed using Komplexity (v.0.3.6).
Reads mapped against mouse host genome (mm10) were filtered out.
Taxonomic assignment of the decontaminated and quality-controlled reads was performed using Kraken 2 (ref.
14 ) to the Kraken 2 database PlusPFP.
Subsequent analysis was performed using the statistical computing environment R v.4.1.2 (ref.
68 ) in RStudio (v.4.2) using the following packages: ape (v.5.5), vegan (v.2.6.4), DESeq2 (v.1.32.0), matrixStats (v.0.61.0), cowplot (v.1.1.1), broom (v.0.7.8), dplyr (v.1.0.7), tidyr (v.1.1.3) and tidyverse (v.2.0.0).
16S rDNA library preparation and microbiome analysis
DNA was amplified using the KAPA Hifi HotStart ReadyMix (Roche) and the F27/R338 primer-pair targeting the V1V2 region of the 16S gene (F27, 5′-AGAGTTTGATCCTGGCTCAG-3′; R338, 5′-TGCTGCCTCCCGTAGGAGT-3′).
After PCR amplification, the pooled library underwent bead-based size selection using AMPure XP beads (Beckman Coulter) and was sequenced using 500 bp paired-end sequencing (Illumina MiSeq).
QIIME 2 (v.2021.2.0) was used to process 16S sequencing reads 69 .
Reads were demultiplexed 70 , quality-filtered 71 and denoised using deblur with a trim-length of 200′ (ref.
72 ).
For taxonomic classification, reads were extracted from the Silva 138 database 73 , 74 using the following parameters: ‘--p-f-primer AGAGTTTGATCCTGGCTCAG --p-r-primer TGCTGCCTCCCGTAGGAGT --p-trunc-len 200’.
These reads were used to train a naive Bayes classifier that was then applied to our dataset.
Downstream analysis was performed in R v.4.1.0 using tidyverse, phyloseq and vegan packages 75 .
To nominate candidate members of the microbiome associated with cognitive decline, we calculated a combined score by multiplying the P values of each taxonomic element from co-housing experiments and faecal microbiota transfer experiments, as well as its longitudinal association with age.
In vitro myeloid differentiation and treatment with GPR84 agonist
Haematopoietic progenitors (LSKs) were isolated from bone marrow and expanded for ten days as previously described 76 .
Progenitors were then differentiated into myeloid cells for one week in IMDM (Thermo Fisher Scientific), 20% FCS (Thermo Fisher Scientific), 1% penicillin–streptomycin–glutamine (Gibco), mouse GM-CSF (10 ng ml –1 ; PeproTech), mouse SCF (10 ng ml –1 ; PeproTech), mouse IL-3 (5 ng ml –1 ; PeproTech), mouse IL-6 (5 ng ml –1 ; PeproTech), mouse FLT3L (5 ng ml –1 ; PeproTech) and mouse TPO (2 ng ml –1 ; PeproTech).
Following differentiation, myeloid cells were replated into 24-well plates at 5 × 10 5 cells per millilitre and treated with LPS (10 mg ml –1 ; Sigma) or vehicle for 4 h.
After LPS treatment, embelin (100 mM; AmBeed) was added and supernatants were collected after 30 min.
IL-1β was measured from the supernatant using ELISA (Invitrogen).
Samples were prepared mostly as previously described 77 , 78 .
Briefly, longitudinal faecal samples of mice at 1, 4, 7, 9, 11, 15, 18, 22 and 25 months old were suspended in lysis buffer (3% SDS, 50 mM (4-(2-hydroxyethyl)-1-piperazineethanesulfonic acid) (HEPES) pH 8.5, 75 mM NaCl + protease inhibitors).
The samples were put on ice and lysed using Cole-Parmer Tissue Homogenizer for five cycles (60 s on and 60 s off cycle), followed by centrifugation at 20,000 × g for 15 min at 4 °C.
The supernatant was taken and reduced with 5 mM dithiothreitol, alkylated with 15 mM iodoacetamide for 30 min at 25 °C and quenched with 5 mM dithiothreitol.
Proteins were purified by methanol–chloroform precipitation.
The dried protein pellet (50 μg each) was resuspended in 50 mM HEPES at pH 8.5 with 8 M urea for denaturation.
The protein mixture was diluted with 50 mM HEPES pH 8.5 to 1 M urea and digested overnight with 33.3 ng μl –1 Trypsin/LysC mix (Promega) at 37 °C, 1000 r.p.m.
Samples were desalted using SepPak cartridges (Waters) and then vacuum-dried.
All samples were then labelled with tandem mass tag (TMT) pro 18plex reagent set (Thermo Fisher Scientific) at a TMT:peptide ratio of 5:1.
Samples were mixed and incubated for 1 h at 25 °C; they were then quenched at 0.5% hydroxylamine, mixed and incubated at room temperature for 15 min.
A small amount of the samples was combined and analysed via LCMS to confirm the labelling efficiency and ratio balancing across the channels before recombining into one set.
The combined samples were then partially dried down to remove acetonitrile, acidified with trifluoroacetic acid to a final concentration of 1%, and then desalted using C18 StageTips, with peptides eluted using 40% acetonitrile with 5% formic acid, and then 80% acetonitrile with 5% formic acid, and dried down under a vacuum at room temperature.
The dried pellet was resuspended in 5% acetonitrile, 10 mM ammonium bicarbonate at pH 8.0, sonicated for 10 min and then fractionated by medium pH reverse phase high-performance liquid chromatography (HPLC; Zorbax 300Extend C18, 4.6 × 250 mm column, 5 µm particle size, Agilent) at 25 °C.
Peptides were eluted with a gradient with initial starting condition of 100% buffer A (5% ACN, 10 mM ammonium bicarbonate) and 0% buffer B (95% ACN, 10 mM ammonium bicarbonate).
Buffer B was increased to 35% over 60 min and then ramped up to 100% B in 6 s, where it held for 5 min.
Buffer B was then decreased to 0% over 6 s and held for 10 min to re-equilibrate the column to original conditions.
The samples were fractionated into 96 fractions, and then pooled into 24 fractions as previously described.
The fractions were dried under vacuum and resuspended in 5% ACN with 5% formic acid, and approximately 1 μg per sample was injected for analysis on an Orbitrap Eclipse as described below.
Samples were analysed on an EASY-nLC 1200 (Thermo Fisher Scientific) HPLC coupled with an Orbitrap Fusion Lumos mass spectrometer (Thermo Fisher Scientific) with Tune version 3.4.
Peptides were separated on an Aurora Series emitter column (25 cm × 75 μm inner diameter, 1.6 μm C18; Ionopticks) and held at 60 °C during separation using an in-house-built column oven over 180 min.
Mass spectrometry data were collected in data-dependent acquisition mode.
A high-resolution MS 1 scan (500–1,200 m / z range, 60,000 resolution, automatic gain control (AGC) 5 × 10 5 , 100 ms maximum injection time, RF for S-lens 30) was collected in the Orbitrap, and the top ten precursors were selected for MS 2 and MS 3 analysis.
Ions were isolated using a 0.5 m / z window for MS 2 spectra.
The MS 2 scan was performed in the quadrupole ion trap (CID, AGC 1 × 10 4 , 30% normalized collision energy, 35 ms maximum injection time) and the MS 3 scan was analysed in the Orbitrap (HCD, 60,000 resolution, maximum AGC 5 × 10 4 , 250 ms maximum injection time, 50% normalized collision energy).
The maximum cycle time was set to 5 s.
For TMT reporter ion quantification, up to six fragment ions from each MS 2 spectra were selected for MS 3 analysis using synchronous precursor selection.
The data was analysed using Masspike software licensed from Harvard (GFY core v.3.8) with a built-in statistical package 79 .
Thermo Fisher Scientific raw files were converted to mzXML using ReAdW.exe.
The assignment of MS 2 spectra was performed using the SEQUEST algorithm v.28 by searching the data against the combined reference proteomes for Mus musculus acquired from SwissProt and microbiome sequences from Multiple Bacteria Genome Compressor database 80 along with common contaminants such as human keratins and trypsin.
The MS/MS spectra were matched with fully tryptic peptides from this composite dataset using a precursor ion tolerance of 20 ppm and a product ion tolerance of 1 Da.
TMT modification of peptide N -termini and lysine residues (+304.2071 Da) and carbamidomethylation of cysteine residues (+57.02146 Da) were set as static modifications.
Oxidation of methionine residues (+15.99492 Da) was set as a variable modification.
Peptide spectral matches were filtered to a 1% false discovery rate using linear discriminant analysis as previously described 81 .
Non-unique peptides that matched to multiple proteins were assigned to proteins that contained the largest number of matched redundant peptides sequences using the principle of Occam’s razor 81 .
Quantification of TMT reporter ion intensities was performed by extracting the most intense ion within a 0.003 m / z window at the predicted m / z value for each reporter ion.
Peptide level intensities and the corresponding reporter ion scans were analysed using the previously described framework for multiplexed mass spectrometry proteomics analysis 79 .
Hippocampus RNA extraction and sequencing
Mice were anaesthetized with isoflurane 1 h after exposure to a novel object and the left hippocampus was rapidly dissected and flash frozen.
Total RNA was extracted using the trizol–chloroform–isopropanol method.
Libraries were prepared using the Illumina Stranded mRNA Prep kit, according to manufacturer’s instructions, and sequenced on a NextSeq 550 instrument using a 75-cycle kit (Illumina).
Quality and quantity control of RNA and libraries were performed using an Agilent 4200 TapeStation and Qubit 4, respectively.
Libraries were sequenced on an Illumina NextSeq instrument to produce 74-base-pair single end reads with an average sequencing depth of ten million reads per sample.
Raw reads were mapped to the mouse reference transcriptome (GRCm38) using Kallisto v.0.46.0 (ref.
82 ).
Subsequent analysis was performed using the statistical computing environment R v.4.1.2 in RStudio v.1.4.17 and Bioconductor v.3.13 (ref.
83 ) in a similar approach as recently published 84 .
Briefly, transcript quantification data were summarized to genes using the tximport package 85 and normalized using the trimmed mean of M values method in edgeR 86 .
Genes with a trimmed mean of M values of less than 1 in n + 1 of the samples (where n is the size of the smallest group of replicates) were filtered.
RNA was isolated with the trizol–chloroform–isopropanol method and complementary DNA was made a high-capacity reverse transcription kit (Applied Biosystems).
Quantitative real-time PCR was performed by using Luna Universal qPCR Master Mix (New England Biolabs) with a 10 μl reaction volume according to manufacturer’s instructions on an Applied Biosystems (Quantstudio v.6) thermal cycler.
The following primer sequences were used: Gpr84 Fwd (5′-AGGTGACCCGTATGTGCTTC-3′) and Rev (5′-GTTCATGGCTGCATAGAGCA-3′), Tnfa Fwd (5′-GGTGCCTATGTCTCAGCCTCTT-3′) and Rev (5′-GCCATAGAACTGATGAGAGGGAG-3′), Il1b Fwd (5′-TGGACCTTCCAGGATGAGGACA-3′) and Rev (5′-GTTCATCTCGGAGCCTGTAGTG-3′), Il6 Fwd (5′-TACCACTTCACAAGTCGGAGGC-3′) and Rev (5′-CTGCAAGTGCATCATCGTTGTTC-3′).
Gapdh or 18S were used as housekeeping genes: Gapdh Fwd (5′-GGGTGTGAACCACGAGAAATATG-3′) and Rev (5′-TGTGAGGGAGATGCTCAGTGTTG-3′), 18S Fwd (5′-CTTAGAGGGACAAGTGGCG-3′) and Rev (5′-ACGCTGAGCCAGTCAGTGTA -3′).
Relative gene expression was calculated by 2 (Ct housekeeping – Ct gene) .
P.
goldsteinii relative abundance was quantified by extracting DNA from stool pellets as described above and the following primers 87 : P.
goldsteinii Fwd (5′-GCAGCACGATGTAGCAATACA-3′) and Rev (5′-TTAACAAATATTTCCATGTGGAAC-3′) and 16S Fwd (5′-GTGSTGCAYGGYTGTCGTCA-3′) and Rev (5′-ACGTCRTCCMCACCTTCCTC-3′) and calculated by 2 (Ct 16S – Ct P.
goldsteinii ) .
Parabacteroides goldsteinii RNA sequencing
P.
goldsteinii was grown in FAB (Neogen) at 37 °C to OD 600 = 0.2 before being infected with multiplicity of infection (MOI) = 1 PDS1 phage and grown for 24 h.
Bacteria were pelleted at 10,000 × g for 5 min and RNA extracted with the trizol–chloroform–isopropanol method.
rRNA was depleted with MICROB Express Bacterial mRNA Enrichment Kit (Thermo).
Libraries were prepared using the Illumina Stranded mRNA Prep kit skipping the poly-A mRNA capture step and sequenced on a NextSeq 2000 instrument using a 100-cycle kit (Illumina).
Quality and quantity control of RNA and libraries were performed using an Agilent 4200 TapeStation and Qubit 4, respectively.
Libraries were sequenced to produce 118-base-pair single end reads with an average sequencing depth of eight million reads per sample.
Raw reads were mapped to a reference genome (NCBI Taxonomy ID 328812) using Kallisto.
Single-cell RNA sequencing analysis
To determine Gpr84 expression in intestinal immune cells, a single cell RNA sequencing dataset of intestinal leucocytes was re-analysed 38 using Seurat v.4 (ref.
88 ).
The data were deposited in GEO (GEO: GSE229321 ).
In brief, data were filtered to remove cells with high mitochondrial reads (> 20%), low gene detection (< 200) and high gene detection (> 4,000).
Data were then normalized using the logNormalize method, highly variable features were determined using the ‘vst’ selection method, and data were scaled.
Principal component analysis was then performed on scaled data as a form of linear dimensional reduction; 50 principal components were computed and stored.
As the majority of true signal was found to be captured in the first 20 principal components, only those were used for cell clustering.
Clustering was performed using the FindClusters function of Seurat v.4 at a resolution of 0.25 and visualized using UMAP.
After normalization and clustering, we used adaptively thresholded low-rank approximation 89 to impute the RNA count matrix and fill in technical dropouts.
The 18–20-month-old mice received 1 × 10 9 pfu of phage supplemented with 100 μl 9% (w/v) sodium bicarbonate via oral gavage on days 1, 3 and 5 before testing on day 8.
P.
distasonis (strain APCS1XY) and P.
goldsteinii were grown in FAB to OD 600 = 0.2 at 37 °C anaerobically; 200 μl of this culture was added to 9.8 ml of fresh media with MOI = 1 phage and OD 600 monitored.
The same was done with E.
coli in lysogeny broth aerobically.
Immunohistochemistry and immunofluorescence of mouse brain
For all FOS quantification experiments, mice were placed into a 1.5 l white bucket (Gramercy) with clean bedding and a novel object (an upside-down 50 ml conical tube filled with dark liquid glued to a 5 cm × 5 cm clear plastic base) for 10 min and then euthanized 1 h later.
Mice were anaesthetized with isoflurane and perfused with ice-cold PBS and 4% PFA before decapitation and brain dissection.
Brains were then fixed in 4% PFA overnight at 4 °C.
For free floating immunofluorescence sections, brains were cut coronally using a Leica 1000S Vibratome at 50 μm, except for the NTS sections and hippocampal sections in Figs.
2e,f and 3o , which were cut at 100 μm.
For immunohistochemistry, brains were processed into paraffin and cut at 6 μm.
For immunohistochemistry, after antigen retrieval for 15 min at 99 °C with citrate buffer, slides were incubated in 5% hydrogen peroxide in water to quench endogenous peroxidase activity.
Slides were washed for 10 min in running tap water, 5 min in 0.1 M Tris and then blocked in 0.1 M Tris with 2% FBS.
Slides were incubated in primary antibody overnight against glial fibrillary acidic protein (GFAP) (Dako; 1:25k).
For GFAP, every 30th section was stained.
For BrdU/NeuN quantification, two hippocampal sections were stained per mouse.
Primary antibody was rinsed off with 0.1 M Tris for 5 min, and then incubated with goat anti-rabbit (Vector) or horse anti-mouse (Vector) biotinylated IgG in 0.1 M Tris/2% FBS 1:1000 for 1 h.
Biotinylated antibody was rinsed off with 0.1 M Tris for 5 min, then incubated with avidin-biotin solution (Vector) for 1 h.
Slides were then rinsed for 5 min with 0.1 M Tris and then developed with ImmPACT DAB peroxidase substrate (Vector) and counterstained briefly with haematoxylin.
Immunohistochemistry sections were scanned with a 3DHISTECH Laminar Scanner (Perkin Elmer) and quantification was done with QuPath 90 .
Free-floating sections were blocked with PBS with 0.1% Triton (PBSTB; Thermo Fisher Scientific) and 1% bovine serum albumin (BioWorld) for 30 min at room temperature.
After blocking, primary antibody staining was conducted overnight at 4 °C in PBSTB.
The primary antibodies used were FOS (CST; 1:1500), NeuN (Millipore; 1:500), Iba1 (Wako; 1:500) and BrdU (Abcam; 1:500).
Sections were washed three times in PBS and incubated in PBSTB with secondary antibodies (donkey anti-rabbit, donkey anti-mouse or donkey anti-rat fluorescent antibodies; Invitrogen Alexa Fluor; 1:500) for 2 h at room temperature.
After three washes in PBS, the sections were mounted onto charged glass slides (Globe Scientific) and coverslipped with Vectashield (Vector) antifade aqueous mounting medium.
Sections were imaged on a Zeiss LSM 710 confocal microscope with a 10 × 0.45 NA objective.
The entire thickness of the section was imaged at 5-μm intervals and maximum intensity projections were used for analysis.
FOS positive cells were quantified using ImageJ.
Each data point is a single mouse, with one to two sections used per mouse.
Scale bars indicate 100 μm, unless specified otherwise.
Golgi stain, imaging and analysis
Golgi staining was performed according to an established protocol 91 , imaged on a microscope and analysed using the AnalyzeSkeleton plugin in ImageJ (ref.
92 ).
Untargeted metabolomics using LC–MS
Metabolites in 20 µl of bacteria culture supernatant were extracted with 80 µl ice-cold acetonitrile:methanol:water (40:40:20) solution.
Following vortexing and centrifugation at 16,000 g for 10 min at 4 °C, 50 µl of supernatant was loaded into MS vials.
Metabolites were analysed by quadrupole-orbitrap mass spectrometer (Q Excative Plus, Thermo Fisher Scientific) coupled to hydrophilic interaction chromatography via electrospray ionization.
Liquid chromatography separation was on an Xbridge BEH amide column (2.1 mm × 150 mm, 2.5 µm particle size, 130 Å pore size; Waters) at 25 °C using a gradient of solvent A (5% acetonitrile in water with 20 mM ammonium acetate and 20 mM ammonium hydroxide) and solvent B (100% acetonitrile).
The flow rate was 150 µl min –1 .
The liquid chromatography gradient was: 0 min, 90% B; 2 min, 90% B; 3 min, 75% B; 7 min, 75% B; 8 min, 70% B; 9 min, 70% B; 10 min, 50% B; 12 min, 50% B; 13 min, 25% B; 14 min, 20% B; 15 min, 20% B; 16 min, 0% B; 20.5 min, 0% B; 21 min, 90% B; 25 min, 90% B.
The autosampler temperature was set to 4 °C and the injection volume of the sample was 3 µl.
Mass spectrometry data were acquired in negative and positive ion modes with a full-scan mode from 70 to 830 m / z at m/Δ m = 140,000 resolution.
Data were analysed using the Compound Discoverer (Thermo Fisher Scientific) software for automated peak picking.
For known metabolites, the identify was confirmed by authentic standards based on retention time, precursor ion, and tandem-mass spectrum generated in-house and Human Metabolome Database.
For data analysis, we focused on compounds from negative mode acquisition that were identified by name.
Approximately 10 mg of lyophilized, powdered caecal contents were homogenized in 200 µl of 80% methanol.
A 50 µl aliquot of homogenate was spiked with 10 µl of 13 C-labelled fatty acid internal standards followed by 50 µl of 200 mM O -benzylhydroxylamine in pH 5 ammonium acetate buffer and 10 µl of 1000 µM 1-ethyl-3-(3-dimethylaminopropyl)carbodiimide for derivatization.
Samples were vortexed and derivatized at room temperature for 10 min.
A 100 µl aliquot of deionized water and 600 µl of ethyl acetate were added and the sample was vortexed and centrifuged at 18,000 × g at 4 °C.
A 50 µl aliquot of the ethyl acetate layer was dried under nitrogen at 35 °C and reconstituted with 100 µl of 50% acetonitrile in water in a 96-well plate.
Calibration standards were similarly prepared.
Decanoic acid and dodecanoic acid were quantitated by multiple reaction monitoring using an Agilent 1290 Infinity UHPLC/6495B triple quadrupole mass spectrometer.
Statistical analysis and reproducibility
Data are presented as mean ± s.e.m.
Replicates represent biologically independent samples.
The significance of the differences between groups was evaluated using ANOVA or a Mann–Whitney U-test, unless indicated otherwise; a P value of <0.05 was considered significant.
Sidak’s post-hoc test was used to correct for multiple comparisons.
For sequencing experiments and metabolomics, P values were adjusted using the Benjamini–Hochberg procedure.
Two-sided testing and paired testing were used where indicated.
Statistical analysis was performed in GraphPad PRISM 10.
To rank members of the microbiome for subsequent functional testing, we have used the following priority score:
where \(\frac{\sum \,({x}_{i}-x)({y}_{i}-y)}{\sqrt{\sum {({x}_{i}-x)}^{2}\sum {({y}_{i}-y)}^{2}}}\) is the correlation coefficient between age x and taxonomic abundance y .
Further information on research design is available in the Nature Portfolio Reporting Summary linked to this article.
Raw sequencing data for this study are available under accession nos.
GSE307834 , GSE307836 and GSE307838 .
Source data are provided with this paper.
Scott, A.
J., Ellison, M.
& Sinclair, D.
A.
The economic value of targeting aging.
Nat.
Aging 1 , 616–623 (2021).
Article PubMed PubMed Central Google Scholar
Pan, R.
Y.
et al.
Intermittent fasting protects against Alzheimer’s disease in mice by altering metabolism through remodeling of the gut microbiota.
Nat.
Aging 2 , 1024–1039 (2022).
Article CAS PubMed Google Scholar
Seo, D.
O.
et al.
ApoE isoform- and microbiota-dependent progression of neurodegeneration in a mouse model of tauopathy.
Science 379 , eadd1236 (2023).
Article CAS PubMed PubMed Central Google Scholar
Boehme, M.
et al.
Microbiota from young mice counteracts selective age-associated behavioral deficits.
Nat.
Aging 1 , 666–676 (2021).
Mossad, O.
et al.
Microbiota-dependent increase in δ-valerobetaine alters neuronal function and is responsible for age-related cognitive decline.
Nat.
Aging 1 , 1127–1136 (2021).
Rei, D.
et al.
Age-associated gut microbiota impair hippocampus-dependent memory in a vagus-dependent manner.
JCI Insight 7 , e147700 (2022).
Josselyn, S.
A.
& Tonegawa, S.
Memory engrams: recalling the past and imagining the future.
Science 367 , eaaw4325 (2020).
Barnes, C.
A.
Normal aging: regionally specific changes in hippocampal synaptic transmission.
Trends Neurosci.
17 , 13–18 (1994).
Gulmez Karaca, K., Brito, D.
V.
C., Kupke, J., Zeuch, B.
& Oliveira, A.
M.
M.
Engram reactivation during memory retrieval predicts long-term memory performance in aged mice.
Neurobiol.
Aging 101 , 256–261 (2021).
Mossad, O.
et al.
Gut microbiota drives age-related oxidative stress and mitochondrial damage in microglia via the metabolite N(6)-carboxymethyllysine.
Nat.
Neurosci.
25 , 295–305 (2022).
D’Amato, A.
et al.
Faecal microbiota transplant from aged donor mice affects spatial learning and memory via modulating hippocampal synaptic plasticity- and neurotransmission-related proteins in young recipients.
Microbiome 8 , 140 (2020).
Lee, K.-E.
et al.
The extracellular vesicle of gut microbial Paenalcaligenes hominis is a risk factor for vagus nerve-mediated cognitive impairment.
Microbiome 8 , 107 (2020).
Li, Y.
et al.
Age-related shifts in gut microbiota contribute to cognitive decline in aged rats.
Aging 12 , 7801–7817 (2020).
Wood, D.
E., Lu, J.
& Langmead, B.
Improved metagenomic analysis with Kraken 2.
Genome Biol.
20 , 257 (2019).
Bousbaine, D.
et al.
A conserved Bacteroidetes antigen induces anti-inflammatory intestinal T lymphocytes.
Science 377 , 660–666 (2022).
Article CAS ADS PubMed PubMed Central Google Scholar
Barnes, C.
A.
Aging and the physiology of spatial memory.
Neurobiol.
Aging 9 , 563–568 (1988).
Cohen, S.
J.
et al.
The rodent hippocampus is essential for nonspatial object memory.
Curr.
Biol.
23 , 1685–1690 (2013).
Anacker, C.
& Hen, R.
Adult hippocampal neurogenesis and cognitive flexibility—linking memory and mood.
Nat.
Rev.
Neurosci.
18 , 335–346 (2017).
Kuhn, H., Dickinson-Anson, H.
& Gage, F.
Neurogenesis in the dentate gyrus of the adult rat: age-related decrease of neuronal progenitor proliferation.
J.
Neurosci.
16 , 2027–2033 (1996).
Sharma, N.
et al.
The emergence of transcriptional identity in somatosensory neurons.
Nature 577 , 392–398 (2020).
Kupari, J., Haring, M., Agirre, E., Castelo-Branco, G.
& Ernfors, P.
An atlas of vagal sensory neurons and their molecular specialization.
Cell Rep.
27 , 2508–2523.e4 (2019).
Scott, M.
M., Williams, K.
W., Rossi, J., Lee, C.
E.
& Elmquist, J.
K.
Leptin receptor expression in hindbrain Glp-1 neurons regulates food intake and energy balance in mice.
J.
Clin.
Investig.
121 , 2413–2421 (2011).
Diepenbroek, C.
et al.
Validation and characterization of a novel method for selective vagal deafferentation of the gut.
Am.
J.
Physiol.
313 , G342–G352 (2017).
Han, W.
et al.
A neural circuit for gut-induced reward.
Cell 175 , 665–678.e23 (2018).
Suarez, A.
N.
et al.
Gut vagal sensory signaling regulates hippocampus function through multi-order pathways.
Nat.
Commun.
9 , 2181 (2018).
Article ADS PubMed PubMed Central Google Scholar
Borgmann, D.
et al.
Gut–brain communication by distinct sensory neurons differently controls feeding and glucose metabolism.
Cell Metabol.
33 , 1466–1482 (2021).
Yang, M.
et al.
Separate orexigenic hippocampal ensembles shape dietary choice by enhancing contextual memory and motivation.
Nat.
Metabol.
7 , 276–296 (2025).
McDougle, M.
et al.
Separate gut-brain circuits for fat and sugar reinforcement combine to promote overeating.
Cell Metab.
36 , 393–407 (2024).
Barrera, J.
G., Sandoval, D.
A., D’Alessio, D.
A.
& Seeley, R.
J.
GLP-1 and energy balance: an integrated model of short-term and long-term control.
Nat.
Rev.
Endocrinol.
7 , 507–516 (2011).
Cortés-Martín, A.
et al.
Isolation and characterization of a novel lytic Parabacteroides distasonis bacteriophage φPDS1 from the human gut.
Gut Microbes 16 , 2298254 (2024).
Porter, N.
T.
et al.
Phase-variable capsular polysaccharides and lipoproteins modify bacteriophage susceptibility in Bacteroides thetaiotaomicron .
Nat.
Microbiol.
5 , 1170–1181 (2020).
Shkoporov, A.
N.
et al.
Long-term persistence of crAss-like phage crAss001 is associated with phase variation in Bacteroides intestinalis.
BMC Biol.
19 , 163 (2021).
Wang, J., Wu, X., Simonavicius, N., Tian, H.
& Ling, L.
Medium-chain fatty acids as ligands for orphan G protein-coupled receptor GPR84.
J.
Biol.
Chem.
281 , 34457–34464 (2006).
Perez, C.
J., Dumas, A., Vallières, L., Guénet, J.-L.
& Benavides, F.
Several classical mouse inbred strains, including DBA/2, NOD/Lt, FVB/N, and SJL/J, carry a putative loss-of-function allele of Gpr84 .
J.
Heredity 104 , 565–571 (2013).
Lattin, J.
E.
et al.
Expression analysis of G protein-coupled receptors in mouse macrophages.
Immun.
Res.
4 , 5 (2008).
Schneider, K.
M.
et al.
The enteric nervous system relays psychological stress to intestinal inflammation.
Cell 186 , 2823–2838 (2023).
Mizutani, M.
et al.
The Fractalkine receptor but not CCR2 is present on microglia from embryonic development throughout adulthood.
J.
Immunol.
188 , 29–36 (2012).
Zhang, Q.
et al.
GPR84 signaling promotes intestinal mucosal inflammation via enhancing NLRP3 inflammasome activation in macrophages.
Acta Pharmacol.
Sin.
43 , 2042–2054 (2022).
Recio, C.
et al.
Activation of the immune-metabolic receptor GPR84 enhances inflammation and phagocytosis in macrophages.
Front.
Immunol.
9 , 1419 (2018).
Mikkelsen, R.
B.
et al.
Type 2 diabetes is associated with increased circulating levels of 3-hydroxydecanoate activating GPR84 and neutrophil migration.
iScience 25 , 105683 (2022).
Laudisi, F.
et al.
Cutting edge: the NLRP3 inflammasome links complement-mediated inflammation and IL-1β release.
J.
Immunol.
191 , 1006–1010 (2013).
Wyss-Coray, T.
Ageing, neurodegeneration and brain rejuvenation.
Nature 539 , 180–186 (2016).
Bieri, G., Schroer, A.
B.
& Villeda, S.
A.
Blood-to-brain communication in aging and rejuvenation.
Nat.
Neurosci.
26 , 379–393 (2023).
Franceschi, C., Olivieri, F., Moskalev, A., Ivanchenko, M.
& Santoro, A.
Toward precision interventions and metrics of inflammaging.
Nat.
Aging 5 , 1441–1454 (2025).
Franck, M.
et al.
Nonuniversality of inflammaging across human populations.
Nat.
Aging 5 , 1471–1480 (2025).
Minhas, P.
S.
et al.
Restoring metabolism of myeloid cells reverses cognitive decline in ageing.
Nature 590 , 122–128 (2021).
Noble, E.
E.
et al.
Gut microbial taxa elevated by dietary sugar disrupt memory function.
Transl.
Psych.
11 , 194 (2021).
Wong, A.
C.
et al.
Serotonin reduction in post-acute sequelae of viral infection.
Cell 186 , 4851–4867 (2023).
Grieco, M.
et al.
Glucagon-like peptide-1: a focus on neurodegenerative diseases.
Front.
Neurosci.
13 , 1112 (2019).
Marlet, I.
R., Ölmestig, J.
N.
E., Vilsbøll, T., Rungby, J.
& Kruuse, C.
Neuroprotective mechanisms of glucagon-like peptide-1-based therapies in ischaemic stroke: a systematic review based on pre-clinical studies.
Basic Clin.
Pharmacol.
Toxicol.
122 , 559–569 (2018).
Steinberg, B.
E.
et al.
Cytokine-specific neurograms in the sensory vagus nerve.
Bioelectron.
Med.
3 , 7–17 (2016).
Clark, K.
B., Naritoku, D.
K., Smith, D.
C., Browning, R.
A.
& Jensen, R.
A.
Enhanced recognition memory following vagus nerve stimulation in human subjects.
Nat.
Neurosci.
2 , 94–98 (1999).
Neuser, M.
P.
et al.
Vagus nerve stimulation boosts the drive to work for rewards.
Nat.
Commun.
11 , 3555 (2020).
McIntire, L.
K., McKinley, R.
A., Goodyear, C., McIntire, J.
P.
& Brown, R.
D.
Cervical transcutaneous vagal nerve stimulation (ctVNS) improves human cognitive performance under sleep deprivation stress.
Commun.
Biol.
4 , 634 (2021).
Desbeaumes Jodoin, V., Richer, F., Miron, J.-P., Fournier-Gosselin, M.-P.
& Lespérance, P.
Long-term sustained cognitive benefits of vagus nerve stimulation in refractory depression.
J.
ECT 34 , 283–290 (2018).
Dohnalová, L.
et al.
A microbiome-dependent gut–brain pathway regulates motivation for exercise.
Nature 612 , 739–747 (2022).
Ohue-Kitano, R.
et al.
Medium-chain fatty acids suppress lipotoxicity-induced hepatic fibrosis via the immunomodulating receptor GPR84.
JCI Insight 8 , e165469 (2023).
Boivin, G.
et al.
Durable and controlled depletion of neutrophils in mice.
Nat.
Commun.
11 , 2762 (2020).
Lai, N.
Y.
et al.
Gut-innervating nociceptor neurons regulate Peyer’s patch microfold cells and sfb levels to mediate salmonella host defense.
Cell 180 , 33–49 (2020).
Chan, K.
Y.
et al.
Engineered AAVs for efficient noninvasive gene delivery to the central and peripheral nervous systems.
Nat.
Neurosci.
20 , 1172–1179 (2017).
Krashes, M.
J.
et al.
Rapid, reversible activation of AgRP neurons drives feeding behavior in mice.
J.
Clin.
Invest.
121 , 1424–1428 (2011).
Whitehead, J.
C.
et al.
A clinical frailty index in aging mice: comparisons with frailty index data in humans.
J.
Gerontol.
A 69 , 621–632 (2014).
Cox, T.
O.
et al.
Anti-PrP C antibody rescues cognition and synapses in transgenic alzheimer mice.
Ann.
Clin.
Transl.
Neurol.
6 , 554–574 (2019).
Clarke, E.
L.
et al.
Sunbeam: an extensible pipeline for analyzing metagenomic sequencing experiments.
Microbiome 7 , 46 (2019).
Dessau, R.
B.
& Pipper, C.
B.
The R project for statistical computing.
Ugeskr.
Læger 170 , 328–330 (2008).
Bolyen, E.
et al.
Reproducible, interactive, scalable and extensible microbiome data science using QIIME 2.
Nat.
Biotechnol.
37 , 852–857 (2019).
Hamady, M., Walker, J.
J., Harris, J.
K., Gold, N.
J.
& Knight, R.
Error-correcting barcoded primers for pyrosequencing hundreds of samples in multiplex.
Nat.
Methods 5 , 235–237 (2008).
Bokulich, N.
A.
et al.
Quality-filtering vastly improves diversity estimates from Illumina amplicon sequencing.
Nat.
Methods 10 , 57–59 (2013).
Amir, A.
et al.
Deblur rapidly resolves single-nucleotide community sequence patterns.
mSystems https://doi.org/10.1128/msystems.00191-16 (2017).
Robeson, M.
S.
II et al.
RESCRIPt: Reproducible sequence taxonomy reference database management.
PLoS Comput.
Biol.
17 , e1009581 (2021).
Quast, C.
et al.
The SILVA ribosomal RNA gene database project: improved data processing and web-based tools.
Nucleic Acids Res.
41 , D590–D596 (2013).
McMurdie, P.
J.
& Holmes, S.
phyloseq: an R package for reproducible interactive analysis and graphics of microbiome census data.
PLoS ONE 8 , e61217 (2013).
Lara-Astiaso, D.
et al.
In vivo screening characterizes chromatin factor functions during normal and malignant hematopoiesis.
Nat.
Genet.
55 , 1542–1554 (2023).
Nguyen, T.
et al.
Differential nuclear import sets the timing of protein access to the embryonic genome.
Nat.
Commun.
13 , 5887 (2022).
Gaun, A.
et al.
Automated 16-plex plasma proteomics with real-time search and ion mobility mass spectrometry enables large-scale profiling in naked mole-rats and mice.
J.
Proteome Res.
20 , 1280–1295 (2021).
O’Brien, J.
J.
et al.
A data analysis framework for combining multiple batches increases the power of isobaric proteomics experiments.
Nat.
Methods 21 , 290–300 (2023).
Grabowski, S.
& Kowalski, T.
M.
MBGC: multiple bacteria genome compressor.
Gigascience 11 , giab099 (2022).
Ting, L., Rad, R., Gygi, S.
P.
& Haas, W.
MS3 eliminates ratio distortion in isobaric multiplexed quantitative proteomics.
Nat.
Methods 8 , 937–940 (2011).
Bray, N.
L., Pimentel, H., Melsted, P.
& Pachter, L.
Near-optimal probabilistic RNA-seq quantification.
Nat.
Biotechnol.
34 , 525–527 (2016).
Huber, W.
et al.
Orchestrating high-throughput genomic analysis with Bioconductor.
Nat.
Methods 12 , 115–121 (2015).
Amorim, C.
F.
et al.
Variable gene expression and parasite load predict treatment outcome in cutaneous leishmaniasis.
Sci.
Transl.
Med.
11 , eaax4204 (2019).
Soneson, C., Love, M.
I.
& Robinson, M.
D.
Differential analyses for RNA-seq: transcript-level estimates improve gene-level inferences.
F1000Res.
4 , 1521 (2015).
Robinson, M.
D., McCarthy, D.
J.
& Smyth, G.
K.
edgeR: a Bioconductor package for differential expression analysis of digital gene expression data.
Bioinformatics 26 , 139–140 (2010).
Gomes-Neto, J.
C.
et al.
A real-time PCR assay for accurate quantification of the individual members of the Altered Schaedler Flora microbiota in gnotobiotic mice.
J.
Microbiol.
Methods 135 , 52–62 (2017).
Stuart, T.
et al.
Comprehensive integration of single-cell data.
Cell 177 , 1888–1902.e21 (2019).
Linderman, G.
C.
et al.
Zero-preserving imputation of single-cell RNA-seq data.
Nat.
Commun.
13 , 192 (2022).
Bankhead, P.
et al.
QuPath: open source software for digital pathology image analysis.
Sci.
Rep.
7 , 16878 (2017).
Zaqout, S.
& Kaindl, A.
M.
Golgi-cox staining step by step.
Front.
Neuroanat.
10 , 38 (2016).
Arganda-Carreras, I., Fernández-González, R., Muñoz-Barrutia, A.
& Ortiz-De-Solorzano, C.
3D reconstruction of histological sections: application to mammary gland tissue.
Microsc.
Res.
Tech.
73 , 1019–1029 (2010).
We thank the members of the Thaiss and Levy laboratories for valuable discussions and input.
We thank I.
Kimura for kindly providing GPR84 knockout mice.
We acknowledge D.
Kobuley and M.
Albright for germ-free animal caretaking and M.
Tetlak for technical assistance.
We thank the RIA Biomarker Core (NIH grant no.
DK019525) of the University of Pennsylvania Diabetes Research Center (DRC).
The Penn Metabolomics Core (RRID:SCR_022381) was supported by the Penn Cardiovascular Institute and NIH grants P30CA016520 and P30DK050306.
T.O.C.
was supported by NIH grants T32AG000255 and F30AG081097.
M.
Subramanian was supported by NIH grant T32GM148377.
L.L.
was supported by NIH grants T32HG000046, F30AG080958 and the Blavatnik Family Fellowship in Biomedical Research.
J.N.B.
was supported by NIH grant R01AG079877.
M.L.
is an Innovation Investigator at the Arc Institute and a Burroughs Wellcome Fund Investigator in the Pathogenesis of Infectious Disease, and was supported by the NIH Director’s New Innovator Award (grant no.
DP2AG067511), an American Cancer Society Scholar Award, The Pew Scholar Award, the Searle Scholar program, the Edward Mallinckrodt Jr Foundation, the W.W.
Smith Charitable Trust, the Prevent Cancer Foundation, Polybio Research Foundation and the V Foundation.
C.A.T.
is a Core Investigator at the Arc Institute, a Pew Biomedical Scholar, a Kathryn W.
Davis Aging Brain Scholar, and a Burroughs Wellcome Fund Investigator in the Pathogenesis of Infectious Disease; C.A.T.
was supported by a McKnight Brain Research Foundation Innovator Award in Cognitive Aging and Memory Loss, a Kenneth Rainin Foundation Innovator Award, an NIH Director’s New Innovator Award (grant no.
DP2AG067492), an NIDDK Catalyst Award (grant no.
DP1DK140021), NIH grants R01NS134976 and R01DK129691, the Edward Mallinckrodt, Jr Foundation, the IDSA Foundation and the Human Frontier Science Program (HFSP).
Department of Microbiology, Perelman School of Medicine, University of Pennsylvania, Philadelphia, PA, USA
Timothy O.
Cox, Ashwarya S.
Devason, Sydney Mason, Madhav Subramanian, Hélène C.
Descamps, Junwon Kim, Yixuan Zhu, Lev Litichevskiy, Iboro C.
Umana, Maria Sacta, Ryan J.
Rahman, Stephen Wisser, J.
Andrew D.
Nelson, Ilona Golynker, Andrea C.
Wong, Klaas Bahnsen & Jihee Kim
Department of Pathology and Laboratory Medicine, Institute on Aging and Center for Neurodegenerative Disease Research, Perelman School of Medicine at the University of Pennsylvania, Philadelphia, PA, USA
Timothy O.
Cox, Kevt’her Hoxha & Virginia Y.-M.
Lee
Monell Chemical Senses Center, Philadelphia, PA, USA
Alan de Araujo, Kuei-Pin Huang, Amber L.
Alhadeff & Guillaume de Lartigue
Department of Neuroscience, Perelman School of Medicine, University of Pennsylvania, Philadelphia, PA, USA
Alan de Araujo, Nathan T.
Henderson, Kuei-Pin Huang, Stephen Wisser, Lavinia Boccia, Amber L.
Alhadeff, Marc V.
Fuccillo, J.
Nicholas Betley & Guillaume de Lartigue
Arc Institute, Palo Alto, CA, USA
Andrea F.
M.
Salvador, Alana M.
McSween, Eric F.
Hohmann, Shaan Patel, Anna L.
Bub, Clara Soekler, Niklas Blank, Maayan Levy & Christoph A.
Thaiss
Department of Pathology, Stanford University, Stanford, CA, USA
Department of Biological Chemistry, University of California Irvine, Irvine, CA, USA
Sunhee Jung, Won-Suk Song & Cholsoon Jang
School of Microbiology and APC Microbiome Ireland, University College Cork, Cork, Ireland
Adrián Cortés-Martín & Colin Hill
Calico Life Sciences LLC, San Francisco, CA, USA
Thao Nguyen, Wisath Sae-Lee & Fiona E.
McAllister
Division of Allergy and Immunology, Children’s Hospital of Philadelphia, Philadelphia, PA, USA
Department of Biology, University of Pennsylvania, Philadelphia, PA, USA
Lavinia Boccia & J.
Nicholas Betley
Department of Psychology and Stanford Center on Longevity, Stanford University, Stanford, CA, USA
Metabolomics Core, Penn Cardiovascular Institute, University of Pennsylvania, Philadelphia, PA, USA
Dina Abbasian, Clarissa Shoffler & Christopher Petucci
Search author on: PubMed Google Scholar
T.O.C.
performed and analysed experiments, interpreted the results and wrote the manuscript.
A.S.D., S.M., M.
Subramanian, A.F.M.S., H.C.D., Junwon Kim, Y.Z., N.T.H., I.C.U., M.
Sacta, R.J.R., S.W., J.A.D.N., I.G., A.M.M., E.F.H., S.P., A.L.B., C.
Soekler, N.
Blank, A.C.W., K.B.
and Jihee Kim performed in vivo and histology experiments.
L.L.
performed computational analysis.
A.d.A.
performed and analysed nodose imaging experiments.
S.J., W.-S.S., D.A.
and C.
Shoffler performed metabolomics experiments.
A.C.-M.
performed bacteriophage experiments.
K.-P.H., K.H.
and L.B.
performed surgeries.
T.N.
and W.S.-L.
conducted and analysed the proteomic experiments.
N.
Biderman, C.P., F.E.M., A.L.A., M.V.F., C.H., C.J., J.N.B., G.d.L., V.Y.-M.L.
and M.L.
supervised the experiments and analysis.
C.A.T.
conceived the project, mentored the participants, interpreted the results and wrote the manuscript.
Correspondence to Maayan Levy or Christoph A.
Thaiss .
T.N., W.S.-L.
and F.E.M.
are employees of Calico Life Sciences LLC.
The remaining authors declare no competing interests.
Nature thanks Sarkis Mazmanian and the other, anonymous, reviewer(s) for their contribution to the peer review of this work.
Publisher’s note Springer Nature remains neutral with regard to jurisdictional claims in published maps and institutional affiliations.
Extended data figures and tables
Extended Data Fig.
1 The aged microbiome impairs cognition.
a , Frailty index in mice after 1 month of co-housing.
Y = young, O = old.
b, c , Novel object recognition (NOR) in mice after 3 (b) and 6 (c) months of co-housing.
d , NOR in male mice after one month of co-housing.
e-g , NOR in co-housed mice with combinations of young and old mice from different vendors as indicated.
JAX = Jackson Laboratory, TAC = Taconic, NIA = National Institute on Aging, CR = Charles River.
h , Time to reach 30 s of total exploration in NOR for co-housed mice.
i , j , Total distance travelled (i), and time in centre (j) during open field testing.
k , m , Time in target quadrant during Barnes maze of co-housed mice (k) and faecal microbiota transplant (FMT) recipients (m).
Dashed line represents chance.
l , NOR in young mice co-housed with other non-littermate young mice.
n , Time to reach 30 s of total exploration in NOR for FMT mice.
o , NOR in young specific pathogen-free (SPF) and germ-free (GF) mice after one month of co-housing.
p , NOR in 3- and 18-month-old SPF and GF mice.
q , r , Schematic of antibiotics (Abx) treatment (p) and NOR (q) in young mice before or after co-housing with aged mice.
none = no Abx, before = Abx applied to aged mice before co-housing, during = Abx applied while co-housing, after = Abx applied after separation.
s , NOR in young and old mice before and after two weeks of antibiotics treatment.
t , Schematic of characterization of the intestinal microbial ecosystem over the lifespan of C57BL/6 mice.
u , v , Frailty index (u) and survival curve (v) in mice monitored across their lifespan.
Error bars indicate means ± s.e.m.
* p < 0.05, ** p < 0.01, *** p < 0.001, **** p < 0.0001.
Exact n and P values are presented in Supplementary Table 2 .
Images in q and t created in BioRender; T, C.
https://biorender.com/lbleqjs (2026).
Extended Data Fig.
2 Microbiome changes across the lifespan.
a , PCoA analysis of microbial taxonomic ordination versus age.
b , Relative abundance of bacterial species across the lifespan.
c-e , PCoA plot of metagenomic gene abundance (c), its principal coordinate 2 (d), and gene abundance clusters (e) over the lifespan.
f-g , Relative abundance of Parabacteroides spp.
and P.
goldsteinii over the lifespan (f), after one month of co-housing (g), and after FMT (h).
i , Decreasing and increasing bacterial taxa over the lifespan based on proteomic measurements in stool.
j , k , Relative abundance of the indicated genera in mice monocolonized with the indicated bacterial species.
Colonization was performed in germ-free (j) or antibiotics-treated mice (k).
l , Relative abundance of Parabacteroides goldsteinii in mice from the indicated vendors and housing conditions.
JAX = Jackson Laboratory, TAC = Taconic, MPF = Murine Pathogen Free, EF = Excluded Flora.
m , n , Relative abundance of Alistipes versus age (m) and during co-housing (n).
o , Relative abundance of Lactobacillus acidophilus across the lifespan.
Error bars indicate means ± s.e.m.
* p < 0.05, ** p < 0.01, *** p < 0.001.
**** p < 0.0001.
Exact n and P values are presented in Supplementary Table 2 .
Extended Data Fig.
3 The impact of the microbiome on brain aging.
a , b , Representative images (a) and quantification (b) of BrdU in the dentate gyrus of control and co-housed mice, scale bar = 100 μm.
c , d , Representative images (c) and quantification (d) of GFAP in the hippocampus of control and co-housed mice, scale bar = 200 μm.
e , f , representative images (e) and quantification (f) of Golgi stain and dendritic spine density in the CA1 of control and co-housed mice, scale bar = 10 μm.
g , Volcano plot of hippocampal gene expression in response to novelty in young mice vs.
young and old mice with aged microbiomes.
h , i , Quantification (h) and representative images (i) of cFos in the dentate gyrus of young and old SPF, GF, and Abx-treated mice with and without exposure to a novel object, scale bar = 200 μm.
Error bars indicate means ± s.e.m.
* p < 0.05, ** p < 0.01, *** p < 0.001, **** p < 0.0001.
Exact n and P values are presented in Supplementary Table 2 .
Extended Data Fig.
4 The aged microbiome impairs neuronal response to novelty.
a-d , cFos staining and quantification in the hippocampus (dentate gyrus (DG), CA1, and CA3), nucleus tractus solitarius (NTS), medial septum (MS), and cortical regions: somatosensory (SC), retrosplenial (RSC), entorhinal (EC), motor (MC), and anterior cingulate (ACC) during aging (a, b) and co-housing (c, d).
Each mouse was exposed to a novel object.
Error bars indicate means ± s.e.m.
* p < 0.05, ** p < 0.01, *** p < 0.001, **** p < 0.0001.
Exact n and P values are presented in Supplementary Table 2 .
Extended Data Fig.
5 TRPV1 + neurons modulate cognition.
a , UMAP plots based on single-cell RNA-sequencing 20 , 21 of nodose and dorsal root ganglia neuronal subsets expressing Trpv1 , Phox2b , or Cckar .
b , Quantification of dentate gyrus area in Trpv1 Cre and Trpv1 DTA mice.
c , d , Representative images (c) and quantification (d) of dentate gyrus cFos in Trpv1 AAV-hM4Di mice with and without CNO treatment.
e , Time to reach 30 s of total exploration in NOR in young and old mice before and after capsaicin treatment.
f , Quantification of cFos + NTS neurons in young mice and co-housed mice treated with capsaicin.
g , Representative cFos images from the dentate gyrus of young mice co-housed with aged mice, with or without capsaicin treatment.
h , NOR in Trpv1 Cre and Trpv1 DTA mice before and after capsaicin treatment.
i-l , NOR (i), representative images (j) and quantification of dentate gyrus (k) and CA1 (l) cFos in Phoxb2 hM4Di mice with and without CNO treatment.
m , representative images of Trpv1-Cre/Phox2b-FlpO tdTomato whole-mouse clearing.
Error bars indicate means ± s.e.m.
* p < 0.05, ** p < 0.01, *** p < 0.001.
Exact n and P values are presented in Supplementary Table 2 .
Extended Data Fig.
6 Afferent sensory input modulates cognition.
a, b , Hot plate (a) and NOR (b) testing in mice injected intrathecally with RTX.
c , NOR in mice after coeliac and superior mesenteric gangliectomy (CG/SMGx).
d , e , Food intake after fast-refeeding with i.p.
CCK administration (d) and NOR (e) in sham- and CCK-SAP-injected mice.
f-k , NOR (f, k), dentate gyrus cFos quantification (g, i, j) and representative images (h) in co-housed (f, g) and aged mice (h-k) with and without i.p.
CCK injection.
l , NOR in Trpv1 Cre and Trpv1 DTA mice before and after i.p.
CCK injection.
m-o , NOR in co-housed and aged mice before and after a single i.p.
injection of GLP-1 or liraglutide.
p-s , Levels of CCK (p, q) in the duodenum and GLP-1 (r, s) in the ileum 45 min after refeeding in co-housed (p, r) and antibiotics-treated mice colonized with P.
goldsteinii or A.
shahii (q, s).
t , u , NOR in mice treated with the CCKAR antagonists devazepide (t) or A-65186 (u).
Error bars indicate means ± s.e.m.
* p < 0.05, ** p < 0.01, *** p < 0.001, **** p < 0.0001.
Exact n and P values are presented in Supplementary Table 2 .
Extended Data Fig.
7 MCFAs increase in aging in a microbiome-dependent manner and are reduced by phage treatment.
a , Serum absorption of oral 3 kDa FITC-dextran in co-housed mice and mice colonized with P.
goldsteinii or A.
shahii .
b , c , NOR in mice gavaged cultured media (Tryptic Soy Broth + 5% defibrinated sheep’s blood) from P.
goldsteinii or A.
shahii size-filtered to less than 3 kDa (b), and size-filtered to less than 3 kDa after growth in Fastidious Anaerobe Broth (FAB) (c).
d , Tissue concentration of 3-HOA at baseline and 20 or 40 min after 100 mg/kg oral gavage.
e , f , Caecal concentrations of decanoic (e) and dodecanoic acid (f) in germ-free mice colonized with the indicated bacterial species.
g , NOR in mice treated with daily oral gavage of vehicle or decanoic acid.
h-l , Caecal concentrations of decanoic (h, j, l) and dodecanoic acid (i, k, l) in young and old specific pathogen-free (SPF) and germ-free (GF) mice (h, i), antibiotics-treated (Abx) mice (j, k), co-housed mice (l).
m , n , NOR in old mice before and after treatment with phage φPDS1 ( P.
distasonis host), φAPCM01 ( Streptococcus mutans host), or φX174 ( E.
coli host).
o-q , In vitro growth curves for P.
distasonis (o), E.
coli (p), and P.
goldsteinii (q) treated with φX174 or φPDS1.
r , Relative abundance of P.
goldsteinii in the stool of mice treated with the indicated phages.
s-u , Principal component analysis (s), differentially expressed genes (t), and functional analysis of differentially expressed genes (u) from RNA-seq analysis of P.
goldsteinii cultures treated with φAPCM01 or φPDS1.
v , w , Caecal concentrations of decanoic (v) and dodecanoic acid (w) in old mice treated with φAPCM01 or φPDS1 phage.
Error bars indicate means ± s.e.m.
* p < 0.05, ** p < 0.01, *** p < 0.001, **** p < 0.0001.
Exact n and P values are presented in Supplementary Table 2 .
Extended Data Fig.
8 The impact of GPR84 and myeloid cells.
a , Sanger sequencing of the Gpr84 locus in C57BL/6 J and DBA/2 J mice demonstrating the 2 bp deletion (TC) at position 350.
b , c , NOR in C57BL/6 J and DBA/2 J mice with or without 3-HOA treatment (b) or at 3, 18, or 23 months of age (c).
d , Relative abundance of P.
goldsteinii in C57BL/6 J and DBA/2 J mice.
e , f , UMAP plot (e) and marker gene expression profiles (f) for intestinal immune cells.
g-j , Brain Iba1 representative images (g, i) and quantification (h, j) for mice treated with vehicle and 3-HOA with control (AIN) or myeloid-cell depleting (PLX) diet (f, g) or clodronate liposomes (h, i).
k-n , Proximal colon (k, l) and brain (m, n) Iba1 representative images and quantification for wild-type and Ccr2 −/− mice.
o , p , Bone marrow engraftment efficiency (o) and blood Gpr84 expression (p) in chimeric mice.
q , Gpr84 expression in monocytes isolated from blood of mixed chimeric mice.
Error bars indicate means ± s.e.m.
* p < 0.05, ** p < 0.01, *** p < 0.001, **** p < 0.0001.
Exact n and P values are presented in Supplementary Table 2 .
Extended Data Fig.
9 Analysis of peripheral inflammation induced by the aged microbiome.
a , NOR in co-housed mice before and after antibody-mediated neutrophil depletion.
b-d , Quantification (b) and representative flow cytometry plots (c, d) of T cell depletion in blood and ileum.
e , NOR before and after antibody-mediated T cell depletion in co-housed mice.
f-g , Quantification (f) and representative flow cytometry plots (g) of NK cell depletion in blood.
h , NOR before and after antibody-mediated NK cell depletion in co-housed mice.
i , IL-1β levels in the supernatant of cultured myeloid cells treated with embelin or vehicle.
j-m , Relative expression of Tnfa , Il1b , and Il6 in the small intestine (j), white adipose tissue (k), spleen (l), and hippocampus (m) of young mice and young mice co-housed with old mice.
Error bars indicate means ± s.e.m.
* p < 0.05, *** p < 0.001.
Exact n and P values are presented in Supplementary Table 2 .
Extended Data Fig.
10 GPR84 signalling drives peripheral inflammation.
a , Concentration of 3-HOA in inguinal white adipose tissue at baseline and 20 or 40 min after 100 mg/kg oral gavage.
b , c , Relative expression of Tnfa , Il1b , and Il6 in mesenteric fat (b) and white adipose tissue (c) of mice treated for with decanoic acid by oral gavage.
d-f , Relative expression of Tnfa (d), Il1b (e), and Il6 (f) in white adipose tissue of young and aged C57BL/6 J as well as old DBA/2 J mice.
g , NOR in young mice with and without TNF or CCK treatment.
h , NOR in young mice before and after treatment with IL-1β.
i , NOR in WT and Tnfr −/− bone marrow chimera mice after treatment with decanoic acid.
j , Proposed signalling pathway of the aged microbiome impairing cognition through increased MCFA production leading to peripheral inflammation, vagal impairment, and cognitive deficits.
Error bars indicate means ± s.e.m.
* p < 0.05, ** p < 0.01, *** p < 0.001.
Exact n and P values are presented in Supplementary Table 2 .
Images in j created in BioRender; T, C.
https://biorender.com/s2mmfpa (2026).
Reporting Summary (download PDF )
Supplementary Table 1 (download XLSX )
Supplementary Table 2 (download XLSX )
n and P -values for each panel.
Source Data Fig.
1 (download XLSX )
Source Data Fig.
2 (download XLSX )
Source Data Fig.
3 (download XLSX )
Source Data Fig.
4 (download XLSX )
Source Data Fig.
5 (download XLSX )
Source Data Extended Data Fig.
1 (download XLSX )
Source Data Extended Data Fig.
2 (download XLSX )
Source Data Extended Data Fig.
3 (download XLSX )
Source Data Extended Data Fig.
4 (download XLSX )
Source Data Extended Data Fig.
5 (download XLSX )
Source Data Extended Data Fig.
6 (download XLSX )
Source Data Extended Data Fig.
7 (download XLSX )
Source Data Extended Data Fig.
8 (download XLSX )
Source Data Extended Data Fig.
9 (download XLSX )
Source Data Extended Data Fig.
10 (download XLSX )
Version of record : 11 March 2026
DOI : https://doi.org/10.1038/s41586-026-10191-6
Related Stories


Source: This article was originally published by Nature News
Read Full Original Article →
Comments (0)
No comments yet. Be the first to comment!
Leave a Comment