Nature ( 2026 ) Cite this article
Epitope-spanning antigenic variation reprograms immunodominance and broadens immunity in sequential influenza vaccination
A single residue in influenza virus H2 hemagglutinin enhances the breadth of the B cell response elicited by H2 vaccination
Immune history shapes human antibody responses to H5N1 influenza viruses
Influenza viruses cause epidemics that result in hundreds of thousands of deaths annually and occasional pandemics that can be much more severe 3 .
Current influenza vaccines offer only partial protection due to multiple factors, including viral escape from immune memory driven by genetic mutation or antigenic drift.
Antigenic drift is exacerbated because the most protective antibodies target the globular head of haemagglutinin (HA), which mediates viral attachment but is more mutagenic, driving escape 4 , 5 , 6 .
In comparison, the HA stalk, which mediates membrane fusion 4 , is highly conserved but less immunogenic 7 , 8 , 9 .
First described as original antigenic sin, which is deleterious, or now as immune imprinting, which also accounts for beneficial effects, immune responses to viruses are biased in various ways by previous exposure to similar strains 1 , 2 .
Imprinting by pre-existing serum antibodies can competitively shift future responses through epitope masking effects or other mechanisms such as Fc-receptor-driven modulation of immunity 10 , 11 , 12 .
Imprinting may also result predominantly from residual memory after the virus mutates key epitopes or from precursor–product relationships, affecting future targeting of evolved epitopes.
Memory B cells have typically undergone affinity maturation to refine antibody binding and specificity 13 , and also respond more rapidly and vigorously 14 , 15 .
Thus, imprinting often causes biased induction of B cell memory to less-protective epitopes of past influenza virus strains in people 16 , 17 or in model systems 18 , 19 , 20 .
These imprinted responses often show effects from childhood exposure decades earlier 17 , 21 , 22 , 23 so that immune history to influenza often predicts future risk 24 , 25 , 26 , 27 .
Evidence for altered susceptibility to influenza infection based on childhood exposures 1 , 17 , 21 , 22 , 23 , 24 , 25 , 26 , 27 has led to conjecture that childhood immune responses are uniquely susceptible to imprinting, although there is also clear evidence that imprinted immune responses can initiate in adults 10 , 28 , 29 .
Comparing B cells in children and adults
To investigate the basis of immune imprinting, we collected blood samples from children aged 2–6 years after sequential first-time (primary) exposures to heterosubtypic influenza viruses, including 13 children with H3N2 followed by H1N1 infections (H3–H1) and seven children with the inverse order of infections (H1–H3) (Fig.
1a ).
For comparison, we also included eight children with first-time H1N1 infections (H1-only) and 12 adults with H1N1 infection (adult H1) (Fig.
1a and Extended Data Table 1 ).
Samples were collected at symptom onset (acute) and after memory B cell responses developed 4–8 weeks later (convalescent).
Acute and convalescent serum IgG titres against H1 and H3 recombinant proteins confirmed exposure histories for all participants (Fig.
1b ).
Consistent with a previous study 31 , cross-subtype boosts in serum antibodies were observed in most children from the H3–H1 and H1–H3 groups (Fig.
1b ).
HA-specific B cells were bait-sorted with oligonucleotide-barcoded probes for 10x Genomics single-cell RNA sequencing (scRNA-seq), following a laboratory-adapted protocol similar to LIBRA-seq 30 (Extended Data Fig.
1a ).
The probes included a panel of HAs from various seasonal influenza viruses, including strains from the years of infection, plus a chimeric HA (cH8/1) with an H1 stalk and an irrelevant avian H8 head to identify HA-stalk-binding B cells (Supplementary Table 1 ).
All four groups showed increases in the percentages of HA-specific B cells from the acute (0.043–0.077%) to the convalescent (0.11–0.27%) phases, with the increase more pronounced in adults (Extended Data Fig.
1c,d ).
The 5′ transcriptome, B cell receptor (BCR) immunoglobulin V(D)J gene repertoire, and surface feature barcode profile were determined for 3,117 HA-specific B cells.
HA antigen specificity predicted by LIBRA-seq probe scores was validated by expressing 150 recombinant monoclonal antibodies from synthesized variable gene cDNAs and testing them by enzyme-linked immunosorbent assay (ELISA).
Expectedly, LIBRA-seq probe scores and monoclonal antibody binding were highly correlated (0.69 < R < 0.81, P < 0.0001) (Fig.
1c and Extended Data Fig.
2 ).
To characterize these monoclonal antibodies thoroughly, we examined their antigen reactivity, neutralization capability, epitope specificity and molecular interactions with cognate and divergent HAs.
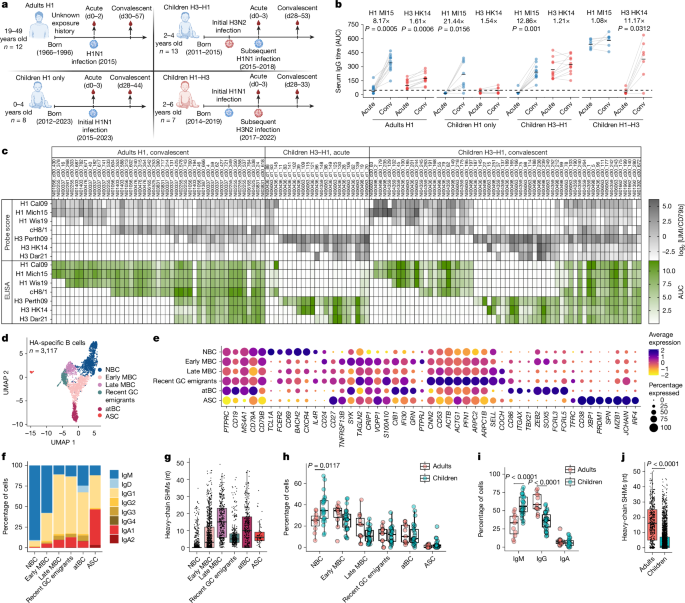
Fig.
1: The B cell response in children is more primary but is phenotypically similar to that of adults.
a , Exposure history and sample collection overview for children and adults after H1N1 (blue) or H3N2 (red) virus infections.
The diagram was created using BioRender; Wilson, P.
https://BioRender.com/43b489t (2026).
d0, day 0.
b , Serum IgG titres against Mich15 H1 and HK14 H3 were measured by ELISA area under the curve (AUC); fold change in the geometric mean (as a straight line) is shown at the top.
n = 12 (adult H1), n = 8 (children, H1 only), n = 11 (children H3–H1), n = 7 (children H1–H3).
Statistical analysis was performed using two-sided Wilcoxon matched-pairs signed-rank tests.
Conv, convalescent.
c , Predicted antigen specificity (probe scores in grey) of HA-specific B cells in the adult H1 and children H3–H1 groups, as well as validated antigen specificity (ELISA AUC in green) of corresponding monoclonal antibodies (mAbs).
UMI, unique molecular identifier.
d , Seurat uniform manifold approximation and projection (UMAP) of HA-specific B cells from all individuals and timepoints combined.
e , Expression of genes of interest in each annotated B cell subset.
The B cell subset with transcriptional signatures of recent GC emigrants (upregulation of genes associated with cytoskeleton remodelling, including ACTB , ACTG1 , PFN1 and ARPC2 ) is identified.
f , g , The percentages of isotype ( f ) and heavy-chain SHMs ( g ) of HA-specific B cells in each B cell subset.
nt, nucleotides.
h , i , The percentages of HA-specific B cells in each B cell subset ( h ) and isotype ( i ) between adults and children.
n = 11 (adults) and n = 26 (children).
Statistical analysis was performed using two-sided unpaired Mann–Whitney U -tests.
j , Heavy-chain SHMs of HA-specific B cells between adults and children.
n = 466 cells (adults) and n = 2,637 cells (children).
Statistical analysis was performed using two-sided unpaired Mann–Whitney U -tests.
The results in b and c represent the average of two technical replicates from one out of two independent experiments.
The box and whisker plots in g – j show first quartile (lower bound of the box), mean (centre line) and third quartile (upper bound of the box), and the whiskers extend to the minimum/maximum values within 1.5× of the interquartile range.
Source data Full size image
a , Exposure history and sample collection overview for children and adults after H1N1 (blue) or H3N2 (red) virus infections.
The diagram was created using BioRender; Wilson, P.
https://BioRender.com/43b489t (2026).
d0, day 0.
b , Serum IgG titres against Mich15 H1 and HK14 H3 were measured by ELISA area under the curve (AUC); fold change in the geometric mean (as a straight line) is shown at the top.
n = 12 (adult H1), n = 8 (children, H1 only), n = 11 (children H3–H1), n = 7 (children H1–H3).
Statistical analysis was performed using two-sided Wilcoxon matched-pairs signed-rank tests.
Conv, convalescent.
c , Predicted antigen specificity (probe scores in grey) of HA-specific B cells in the adult H1 and children H3–H1 groups, as well as validated antigen specificity (ELISA AUC in green) of corresponding monoclonal antibodies (mAbs).
UMI, unique molecular identifier.
d , Seurat uniform manifold approximation and projection (UMAP) of HA-specific B cells from all individuals and timepoints combined.
e , Expression of genes of interest in each annotated B cell subset.
The B cell subset with transcriptional signatures of recent GC emigrants (upregulation of genes associated with cytoskeleton remodelling, including ACTB , ACTG1 , PFN1 and ARPC2 ) is identified.
f , g , The percentages of isotype ( f ) and heavy-chain SHMs ( g ) of HA-specific B cells in each B cell subset.
nt, nucleotides.
h , i , The percentages of HA-specific B cells in each B cell subset ( h ) and isotype ( i ) between adults and children.
n = 11 (adults) and n = 26 (children).
Statistical analysis was performed using two-sided unpaired Mann–Whitney U -tests.
j , Heavy-chain SHMs of HA-specific B cells between adults and children.
n = 466 cells (adults) and n = 2,637 cells (children).
Statistical analysis was performed using two-sided unpaired Mann–Whitney U -tests.
The results in b and c represent the average of two technical replicates from one out of two independent experiments.
The box and whisker plots in g – j show first quartile (lower bound of the box), mean (centre line) and third quartile (upper bound of the box), and the whiskers extend to the minimum/maximum values within 1.5× of the interquartile range.
A long-standing hypothesis is that the immune system of young children is uniquely susceptible to immune imprinting.
To gain insights into this issue, we conducted an integrated analysis of single-cell transcriptomes from HA-specific B cells alongside over 128,000 total CD19 + B cells from all participants to compare B cell subsets identified by transcriptional clusters (Fig.
1d,e and Extended Data Figs.
1b and 4a,c ).
On the basis of the top 10 differentially expressed genes (DEGs), gene set enrichment analysis (GSEA) on the DEGs and the expression of known marker genes, we identified six major B cell differentiation subsets, including transitional B cells (TBCs), naive B cells (NBCs), both early and late memory B cells (MBCs), recent germinal centre (GC) emigrants, atypical B cells (atBCs) and antibody-secreting cells (ASCs) (Extended Data Figs.
3d,h and 4d ).
The B cell subsets were further validated by BCR profiling.
Specifically, early-MBCs had lower levels of class-switching and somatic hypermutations (SHMs) (46.7 ± 9.9%; 7.6 nucleotides) compared with late-MBCs (89.1 ± 8.5%; 16.3 nucleotides), while recent GC emigrants were predominantly class-switched but exhibited low levels of SHMs (91.2 ± 7.9%; 7.9 nucleotides) (Fig.
1f,g ).
atBCs were also observed in children after the first infection (H1-only) with low levels of class-switching and SHMs (38.5 ± 8.9%; 3.1 nucleotides), suggesting that they can arise from activated B cells and early/late-MBCs (Extended Data Fig.
3e,f ).
Among total CD19 + B cells, there were slightly more TBCs and fewer late-MBCs in children (TBCs, 12 ± 5%; late-MBCs, 5.5 ± 4.3%) compared with adults (TBCs, 5.7 ± 3%; late-MBCs, 12.7 ± 7.1%), which is expected as children should have less immunological history (Extended Data Fig.
4b ).
All subsets of HA-specific B cells were comparable between adults and children, with more NBCs (adults, 24.2 ± 8.9%; children, 36.4 ± 13.5%) and fewer MBCs in children (adults, 50 ± 11.6%; children, 37.6 ± 8.3%) (Fig.
1h ).
Certain genes were upregulated in children ( IFI44L , SOX5 , FCRL3 and CD38 ), suggesting subtle transcriptional differences between adults and children within particular B cell subsets (Extended Data Fig.
3a–c ).
The immunoglobulin variable (IgV) genes from children’s HA-specific B cells were less frequently class-switched and had fewer SHMs (42.3 ± 8.7%; 5.2 nucleotides) compared with adults (69.7 ± 9.7%; 16.3 nucleotides) (Fig.
1i,j and Extended Data Fig.
3e,f ).
Two to three exposures to influenza viruses in children were previously shown to result in SHM rates similar to those of adults 32 , confirming primary immune responses in this study.
Overall, while some gene expression differences were noted, these data suggest that no fundamental differences in overall B cell phenotypes drive imprinting in children.
Memory recall responses in children
We next evaluated the consequences of consecutive first infections with both subtypes of seasonal influenza A viruses in young children.
For this, LIBRA-seq probe scores were used to assess the specificity of affinity-matured HA-specific B cells (Fig.
2a ).
At acute timepoints, occurring within a few days of symptom onset after H1N1 virus infection, there was a clear bias towards H3 reactivity, with expansion of H3-reactive B cells in both the H3–H1 group of children (82%) and the H1 group adults (69%) (Fig.
2b ).
Although adults had unknown exposure histories, they may have had recent, more frequent or more robust past H3 exposures, as suggested by higher acute serum antibody titres to H3 (Fig.
1b ).
Four to eight weeks after infection (convalescence), H1-reactive B cells became predominant in both the H3–H1 group of children (70%, H1-specific plus H1/H3 cross-reactive) and the H1 group of adults (82%) (Fig.
2b,c ).
The H1–H3 group of children exhibited increased H3-reactive B cells (56%) at the acute timepoint, with further expansion by convalescence (64%) (Fig.
2b,c ).
The H3-specific cells from the H1–H3 group of children also had higher SHMs (7.1 nucleotides) compared with H1-specific cells from the H3–H1 group of children (5.5 nucleotides) (Fig.
2d ).
No acute H3 serum antibody was detected in the H1–H3 group of children, and no non-specific memory recruitment against H3 at the cellular level was detected in H1-only children (Figs.
1b and 2b ), suggesting no unappreciated contribution of pre-existing memory to the earlier expansion and increased SHM levels observed for H3-specific B cells.
Other possible explanations include that H3N2 virus infection delayed symptom onset, providing more time for expansion before presentation, or that responses to H3N2 were more rapid or driven by greater T cell help.
Both the H3–H1 and H1–H3 groups of children had lower SHM accumulation to the current than to the previous infecting strains, supporting de novo rather than back-boosted responses (Fig.
2d ).
All adult B cells showed extensively mutated IgV genes, indicating repeated exposures to H1N1 and H3N2 viruses (Fig.
2d ).
In children infected solely with H1N1, all HA-specific B cells were H1-reactive, with few IgV SHMs (Fig.
2d ).
For the H3–H1 and H1–H3 groups of children, 4–6% of H1/H3 cross-reactive B cells became detectable at convalescence and showed IgV genes with higher SHMs (H3–H1, 14.5 nucleotides; H1–H3, 14 nucleotides) than those specific to the infecting subtypes (H3–H1, 5.5 nucleotides; H1–H3, 7.1 nucleotides), suggesting a back-boosted origin (Fig.
2b,d ).
Most (91–92%) recent GC emigrant B cells from children were specific to the current infecting subtypes (Fig.
2e and Extended Data Fig.
3g ).
In conclusion, sequential heterosubtypic primary infections in children trigger strong de novo responses, with 5% of the memory B cells cross-reacting to both imprinting and infecting strains.
Fig.
2: Sequential heterosubtypic infections in children induce minimal memory recall and robust de novo responses.
a , The predicted antigen specificity (probe scores coloured by subtype reactivity) of convalescent HA-specific B cells in the adult H1 and children H3–H1 groups.
b , The percentages of H1-reactive (blue), H3-reactive (red) and H1/H3-cross-reactive (CR; purple) B cells in each group at the acute and convalescent timepoints.
c , Data at the convalescent timepoint in b shown by individual.
Only participants with more than ten cells are shown.
n = 12 (adult H1), n = 12 (children H3–H1) and n = 4 (children H1–H3).
Mean is shown as a straight line.
Statistical analysis was performed using two-sided Wilcoxon matched-pairs signed-rank tests.
d , Heavy-chain SHMs of HA-specific B cells at the convalescent timepoint in b .
n = 344 H1-reactive cells (children H1 only), n = 334 H1-reactive cells (children H3–H1), n = 219 H3 reactive cells (children H1–H3).
Mean is shown as a straight line.
Statistical analysis was performed using two-sided unpaired Mann–Whitney U -tests.
e , UMAP projections highlighting recent GC emigrants in each group coloured by subtype reactivity; the percentages are shown in pie charts.
NS, not significant.
Source data Full size image
a , The predicted antigen specificity (probe scores coloured by subtype reactivity) of convalescent HA-specific B cells in the adult H1 and children H3–H1 groups.
b , The percentages of H1-reactive (blue), H3-reactive (red) and H1/H3-cross-reactive (CR; purple) B cells in each group at the acute and convalescent timepoints.
c , Data at the convalescent timepoint in b shown by individual.
Only participants with more than ten cells are shown.
n = 12 (adult H1), n = 12 (children H3–H1) and n = 4 (children H1–H3).
Mean is shown as a straight line.
Statistical analysis was performed using two-sided Wilcoxon matched-pairs signed-rank tests.
d , Heavy-chain SHMs of HA-specific B cells at the convalescent timepoint in b .
n = 344 H1-reactive cells (children H1 only), n = 334 H1-reactive cells (children H3–H1), n = 219 H3 reactive cells (children H1–H3).
Mean is shown as a straight line.
Statistical analysis was performed using two-sided unpaired Mann–Whitney U -tests.
e , UMAP projections highlighting recent GC emigrants in each group coloured by subtype reactivity; the percentages are shown in pie charts.
NS, not significant.
Homosubtypic imprinting in adults
To further assess de novo responses in children, we next compared epitope and repertoire features of H1-specific B cells between groups, focusing on cells from the H1 group adults and the H3–H1 group of children.
Cells that bound to both whole H1 and cH8/1 probes were identified as stalk-binding.
Most H1-specific B cells from the H1-only and H3–H1 groups of children were head binding (H1-only, 65.9 ± 12%; H3–H1, 60 ± 10.1%), indicating immunodominance of the head domain during primary responses (Fig.
3a ).
Yet, the head/stalk ratios were highly variable in the H1 group of adults and the H1–H3 group of children.
IgV gene SHM levels of H1-specific B cells were similar for the H1-only and H3–H1 groups of children, but were overall less mutated in children than in adults (Fig.
3b ).
On the basis of known stereotypical repertoire features and cH8/1 binding, we predicted the frequencies of H1-specific B cells targeting common epitopes, including central stalk (VH1-69/1-18/6-1) 33 , anchor (VH3-23/3-30/3-48+NWP motif) 34 and trimer interface (VK1-39+Y49&Q55) 35 , 36 epitopes (Fig.
3c ).
Despite an enrichment of stereotypical central stalk-binding cells in adults (H1 group of adults, 18.4 ± 12.8%; H3–H1 group of children, 6.7 ± 4.5%), the overall distribution of epitope targeting was comparable across all groups (Fig.
3d ).
Out of the 18 monoclonal antibodies from pre-existing H3-specific memory B cells in the H3–H1 group of children, 61% (11 out of 18) were cross-neutralizing against multiple H3N2 strains and 67% (12 out of 18) were haemagglutination inhibition (HAI) positive, consistent with HA head immunodominance (Fig.
3e ).
Fig.
3: Common cross-reactivity and more stereotyped repertoire reveal substantial homosubtypic imprinting in adults.
a , The proportions of all H1-specific B cells (H1 binders) in each group targeting head versus stalk.
n = 12 (adult H1), n = 7 (children H1 only), n = 11 (children H3–H1) and n = 6 (children H1–H3).
Mean is shown as a straight line.
Statistical analysis was performed using two-sided Wilcoxon matched-pairs signed-rank tests.
b , Heavy-chain SHMs of H1 binders in a .
n = 154 H1 head binders and n = 103 H1 stalk binders (adult H1); n = 185 H1 head binders and n = 126 H1 stalk binders (children H3–H1).
Mean is shown as a straight line.
Statistical analysis was performed using two-sided unpaired Mann–Whitney U -tests.
c , Surface footprints and repertoire features for the indicated epitopes shown in Cal09 H1 HA (PDB: 4JTV ).
d , The percentages of H1 binders targeting each epitope in individual participants of each group.
The box and whisker plots show the first quartile (lower bound of the box), mean (centre line) and third quartile (upper bound of the box), and the whiskers extend to the minimum/maximum values (within 1.5× of the interquartile range).
n = 12 (adult H1) and n = 12 (children H3–H1).
Statistical analysis was performed using two-sided unpaired Mann–Whitney U -tests.
Adjusted P values are shown for multiple comparisons.
e , ELISA AUC, HAI titre and microneutralization half-maximum inhibitory concentration (IC 50 ) of H3-specific monoclonal antibodies in the H3–H1 group of children against the indicated HAs and viruses.
HC, heavy chain.
f , HAI titre, ELISA AUC and half-maximum focus reduction neutralization (FRNT 50 ) of head and stalk monoclonal antibodies from subsets of H1 binders in the adult H1 and children H3–H1 groups against the indicated HAs and viruses.
The results in e and f represent the average of two technical replicates from one of the two independent experiments.
Source data Full size image
a , The proportions of all H1-specific B cells (H1 binders) in each group targeting head versus stalk.
n = 12 (adult H1), n = 7 (children H1 only), n = 11 (children H3–H1) and n = 6 (children H1–H3).
Mean is shown as a straight line.
Statistical analysis was performed using two-sided Wilcoxon matched-pairs signed-rank tests.
b , Heavy-chain SHMs of H1 binders in a .
n = 154 H1 head binders and n = 103 H1 stalk binders (adult H1); n = 185 H1 head binders and n = 126 H1 stalk binders (children H3–H1).
Mean is shown as a straight line.
Statistical analysis was performed using two-sided unpaired Mann–Whitney U -tests.
c , Surface footprints and repertoire features for the indicated epitopes shown in Cal09 H1 HA (PDB: 4JTV ).
d , The percentages of H1 binders targeting each epitope in individual participants of each group.
The box and whisker plots show the first quartile (lower bound of the box), mean (centre line) and third quartile (upper bound of the box), and the whiskers extend to the minimum/maximum values (within 1.5× of the interquartile range).
n = 12 (adult H1) and n = 12 (children H3–H1).
Statistical analysis was performed using two-sided unpaired Mann–Whitney U -tests.
Adjusted P values are shown for multiple comparisons.
e , ELISA AUC, HAI titre and microneutralization half-maximum inhibitory concentration (IC 50 ) of H3-specific monoclonal antibodies in the H3–H1 group of children against the indicated HAs and viruses.
HC, heavy chain.
f , HAI titre, ELISA AUC and half-maximum focus reduction neutralization (FRNT 50 ) of head and stalk monoclonal antibodies from subsets of H1 binders in the adult H1 and children H3–H1 groups against the indicated HAs and viruses.
The results in e and f represent the average of two technical replicates from one of the two independent experiments.
Heterosubtypic imprinting in children
To assess the impact of previous heterosubtypic imprinting on the affected B cell clones, we next focused our analysis on the 4–6% H1/H3 cross-reactive B cells in children.
Importantly, before the second infection, these B cells would constitute the entire pre-existing cross-reactive memory response.
H1/H3 cross-reactive B cells showed distinct variable heavy chain (VH) gene use between adults and children, with enrichments of distinct stereotypical IgV gene pairings in the H1 group of adults (VH1-18+VK2-30) 33 versus the H3–H1 group of children (VH3-30+VL2-14/2-23; VH3-48+VK1-39) 37 (Fig.
4b ).
We next characterized all H1/H3 cross-reactive monoclonal antibodies from seven adults in the H1 group (19 monoclonal antibodies) and seven children in the H3–H1 group (19 monoclonal antibodies).
As predicted by LIBRA-seq, 95% (36 out of 38) of these monoclonal antibodies bound to both cH8/1 and cH4/3 chimeric HAs, indicating that they targeted the conserved cross-group central stalk epitope (Fig.
4a ).
While 68% (13 out of 19) of monoclonal antibodies from both adults and children were neutralizing to the infecting Mich15-like H1N1 viruses, the adult monoclonal antibodies averaged an order-of-magnitude greater neutralization potency (adults, 0.33 μg ml −1 ; children, 3.25 μg ml −1 ) (Fig.
4a,d ).
The attenuated potency of children’s monoclonal antibodies may be influenced by reduced affinity maturation, minimal selection over a lifetime and/or a shift in reactivity due to H3-imprinting.
Cross-group antibodies targeting the central stalk epitope typically bind to most human H1N1 strains, including those circulating before the major antigenic shift during the 2009 H1N1 pandemic 33 .
As expected, most adult monoclonal antibodies with broad reactivity to H1 and H3 strains bound to a wide range of historical and recent influenza virus strains, as well as other group 1 (H2, H5, H9) and group 2 (H7, H10) subtypes tested (Fig.
4a ).
Among neutralizing monoclonal antibodies from adults, 77% (10 out of 13) were broadly neutralizing antibodies against both pre- and post-2009 pandemic H1N1 strains (Fig.
4a,d ).
By contrast, although some of the children’s monoclonal antibodies bound to pre-pdm strains, none of the 19 monoclonal antibodies from seven children in the H3–H1 group could neutralize any of the pre-pdm strains tested, representing a substantial gap in coverage across at least seven decades of H1N1 virus evolution (Fig.
4a,d ).
Furthermore, in contrast to those from adults, most children’s monoclonal antibodies were not reactive to H2 strains that pose a pandemic threat (H1 group of adults, 84%; H3–H1 group of children, 21%) (Fig.
4a ).
This profound narrowing in breadth may have resulted from either H3 imprinting in the H3–H1 group of children or a lack of previous exposure to pre-pdm strains, as in adults (Fig.
3f ).
To distinguish these possibilities, we characterized all 12 H1/H3 cross-reactive monoclonal antibodies from four children in the H1–H3 group who were first infected with H1N1 viruses and found that 83% (10 out of 12) were neutralizing (Fig.
4a,d ).
Notably, like antibodies from adults, the monoclonal antibodies from the H1–H3 group of children were mostly reactive to H2 strains (83%) and showed a predominance of neutralization against H1N1 strains over H3N2 strains, suggesting H1 imprinting (Fig.
4a,d ).
Despite being born after 2015, and therefore never exposed to pre-pdm strains, children in the H1–H3 group produced neutralizing cross-group monoclonal antibodies that were 90% (9 out of 10) broadly neutralizing against both pre-pdm and pdm strains (Fig.
4a,d ).
This observation suggests that the narrowing in breadth of monoclonal antibodies from the H3–H1 group of children was indeed caused by H3 imprinting.
To evaluate the reduced breadth in vivo, we administered a cocktail of 10 broadly neutralizing antibodies from the H3–H1 or H1–H3 groups of children prophylactically (2 h before infection) to mimic the polyclonal responses derived from imprinting and then challenged mice with a lethal dose of mouse-adapted pre-pandemic A/New Caledonia/20/1999 (NC99) H1N1 virus, post-pandemic A/New York City/PV63249/2022 H1N1 virus or A/New York City/PV63311/2022 H3N2 virus (Supplementary Table 2 ).
Both cocktails protected mice from lethal infections with H1N1 or H3N2 viruses circulating in 2022 with similar stalk epitopes to the imprinting or subsequent infecting strains in our cohorts (Fig.
4e ).
However, only 40% of mice receiving the H3–H1 cocktail survived challenges with NC99, whereas all mice receiving the H1–H3 cocktail survived (Fig.
4e ).
Finally, broadly neutralizing antibodies from all three groups were more broadly and potently neutralizing against heterosubtypic avian strains belonging to the same virus group as the imprinting strains (Extended Data Fig.
6 ).
Together, these findings indicate that previous first infections with heterosubtypic influenza strains predominantly imprint B cells that target the highly conserved central stalk epitope on HA, producing antibodies with reduced breadth and potency after second infections.
Fig.
4: Heterosubtypic imprinting of H1/H3 cross-reactive B cells occurs in an epitope-specific manner and drives major reactivity shifts.
a , ELISA AUC, FRNT 50 , BLI equilibrium dissociation constant ( K d ) of Fabs and the germline specificity of H1/H3 cross-group monoclonal antibodies against indicated HAs and viruses.
Squares filled with an X indicate untested Fabs or monoclonal antibodies.
b , VH and VK/L pairing of H1/H3 cross-group monoclonal antibodies from the indicated groups.
c , The K d of Fabs in a against Mich15 H1 and HK14 H3; affinity bias is indicated by colour.
Mean is shown as a straight line.
All values higher than 1,000 nM are categorized as negative and replaced by 2,000 nM.
n = 14 (adult H1), n = 15 (children H3–H1) and n = 10 (children H1–H3) monoclonal antibodies.
Statistical analysis was performed using two-sided Wilcoxon matched-pairs signed-rank tests.
d , The neutralization potency (IC 50 ) of monoclonal antibodies in a against the indicated viruses.
All values higher than 100 μg ml −1 are categorized as negative and replaced by 250 μg ml −1 .
Monoclonal antibodies tested negative to all viruses are excluded.
The box and whisker plots show the first quartile (lower bound of the box), mean (centre line) and third quartile (upper bound of the box), and the whiskers extend to the minimum/maximum values (within 1.5× of the interquartile range).
n = 14 (adult H1), n = 15 (children H3–H1) and n = 10 (children H1–H3) monoclonal antibodies.
Statistical analysis was performed using two-sided unpaired Mann–Whitney U -tests.
Adjusted P values are shown for multiple comparisons.
e , Weight loss (top) and survival (bottom) of mice that were prophylactically administered (intraperitoneal; 2 h before infections with 5 half-maximum lethal dose (LD 50 ) of the indicated viruses) a cocktail of H1/H3 cross-reactive monoclonal antibodies ( n = 10, 1 mg per kg) from the H3–H1 or H1–H3 group of children.
n = 5 mice for each group.
For weight loss, data are mean ± s.d.
Statistical analysis was performed using the log-rank (Mantel–Cox) test.
f , Competition ELISA between H1/H3 cross-group monoclonal antibodies from children in the H3–H1 group with two central stalk monoclonal antibodies (CR9114 and NI04359_d30_175) and a published monoclonal antibody (222_1C06) that targets a highly conserved, membrane-proximal epitope (anchor) on HA stalk.
The results in a , c , d and f represent the average of two technical replicates from one out of the two independent experiments.
Source data Full size image
a , ELISA AUC, FRNT 50 , BLI equilibrium dissociation constant ( K d ) of Fabs and the germline specificity of H1/H3 cross-group monoclonal antibodies against indicated HAs and viruses.
Squares filled with an X indicate untested Fabs or monoclonal antibodies.
b , VH and VK/L pairing of H1/H3 cross-group monoclonal antibodies from the indicated groups.
c , The K d of Fabs in a against Mich15 H1 and HK14 H3; affinity bias is indicated by colour.
Mean is shown as a straight line.
All values higher than 1,000 nM are categorized as negative and replaced by 2,000 nM.
n = 14 (adult H1), n = 15 (children H3–H1) and n = 10 (children H1–H3) monoclonal antibodies.
Statistical analysis was performed using two-sided Wilcoxon matched-pairs signed-rank tests.
d , The neutralization potency (IC 50 ) of monoclonal antibodies in a against the indicated viruses.
All values higher than 100 μg ml −1 are categorized as negative and replaced by 250 μg ml −1 .
Monoclonal antibodies tested negative to all viruses are excluded.
The box and whisker plots show the first quartile (lower bound of the box), mean (centre line) and third quartile (upper bound of the box), and the whiskers extend to the minimum/maximum values (within 1.5× of the interquartile range).
n = 14 (adult H1), n = 15 (children H3–H1) and n = 10 (children H1–H3) monoclonal antibodies.
Statistical analysis was performed using two-sided unpaired Mann–Whitney U -tests.
Adjusted P values are shown for multiple comparisons.
e , Weight loss (top) and survival (bottom) of mice that were prophylactically administered (intraperitoneal; 2 h before infections with 5 half-maximum lethal dose (LD 50 ) of the indicated viruses) a cocktail of H1/H3 cross-reactive monoclonal antibodies ( n = 10, 1 mg per kg) from the H3–H1 or H1–H3 group of children.
n = 5 mice for each group.
For weight loss, data are mean ± s.d.
Statistical analysis was performed using the log-rank (Mantel–Cox) test.
f , Competition ELISA between H1/H3 cross-group monoclonal antibodies from children in the H3–H1 group with two central stalk monoclonal antibodies (CR9114 and NI04359_d30_175) and a published monoclonal antibody (222_1C06) that targets a highly conserved, membrane-proximal epitope (anchor) on HA stalk.
The results in a , c , d and f represent the average of two technical replicates from one out of the two independent experiments.
Imprinted antibodies are often predicted to have higher affinity to the imprinting strain than the infecting strain.
Thus, Fabs were generated from all broadly neutralizing antibodies for binding kinetics and affinity measurements against Mich15 H1 and A/Hong Kong/4801/2014 (HK14) H3 using biolayer interferometry (BLI).
Nearly all Fabs (13 out of 15) from the H3–H1 group of children showed higher affinity to HK14 H3 (H3, 0.023 ± 0.055 μM; H1, 0.8 ± 0.89 μM; H3 biased), whereas all Fabs from the H1–H3 group of children showed higher affinity to Mich15 H1 (H1, 0.0048 ± 0.0063 μM; H3, 1.3 ± 0.91 μM; H1 biased) (Fig.
4a,c ).
Fabs from the H1 group of adults showed equal proportions of H3 or H1 bias, probably reflecting a complex immune history with influenza over a lifetime (Fig.
4a,c ).
To verify the inducing strains of these B cells expressing broadly neutralizing antibodies, we expressed germline-reverted broadly neutralizing antibodies with predicted germline V(D)J sequences before the SHM-driven adaptation and tested their binding to H1, H2 and H3 HAs from strains near the birth years of the adults and children (Supplementary Table 3 ).
The highest affinity of most of the predicted germline broadly neutralizing antibodies was to the imprinting rather than the infecting strains, verifying the imprinted origins (Fig.
4a ).
While most germline broadly neutralizing antibodies from adults and children in the H1–H3 group were specific to the imprinting strains, over half of those from the H3–H1 group of children were H1/H3 cross-reactive to some degree (Fig.
4a ).
This observation suggests that the H1-imprinted B cells targeting the central stalk mainly developed cross-binding to H3 through affinity maturation, whereas H3-imprinted B cells tend to be more predisposed to cross-group binding at the germline level.
Notably, a third of the germline broadly neutralizing antibodies from adults were specific to A/Singapore/1/1957 H2, suggesting that these clones were originally induced against H2N2 strains (in 1957–1968) and subsequently adapted to H1N1 or H3N2 strains (Fig.
4a ).
The presence of H3-imprinted broadly neutralizing antibodies in serum might also affect subsequent immunity to the H1 stalk through steric hindrance or reduced antigen availability.
Notably, all H3-imprinted broadly neutralizing antibodies could readily inhibit H1 binding by either the high-affinity prototypical anti-stalk monoclonal antibody CR9114 8 or by NI04359_d30_175, an H1-specific VH1–69 class stalk monoclonal antibody from the H3–H1 group of children, suggesting a potential impediment to de novo H1 stalk responses (Fig.
4f ).
In summary, we conclude that heterosubtypic imprinting occurs in an epitope-specific manner and can cause considerable functional and reactivity shifts in most antibodies that cross-react with the contemporaneous and imprinting strains.
Mechanisms of stalk antibody impairments
To elucidate the molecular mechanisms causing altered reactivity to the stalk epitope driven by H3-imprinting, we determined the cryo-electron microscopy (cryo-EM) structures of two cross-group broadly neutralizing antibodies from the H3–H1 group of children in a complex with HK14 H3 and Mich15 H1 at overall resolutions ranging from 2.62 to 3.12 Å (Extended Data Fig.
7a–d and Supplementary Table 4 ).
Both broadly neutralizing antibodies targeted the conserved central stalk region of HA (Fig.
5a,b ), but approached HK14 H3 and Mich15 H1 with slightly different angular orientations, accommodating the surrounding N-linked glycans on each HA (Fig.
5c,d ).
Consistent with their higher affinities to HK14 H3 than to Mich15 H1 measured by BLI and ELISA (Fig.
4a,c and Supplementary Table 5 ), both broadly neutralizing antibodies exhibited a larger buried surface area on HK14 H3 and accordingly showed more extensive interactions with the major epitope region on helix A of HA2 in the HK14 H3 complex (Fig.
5e–h and Supplementary Tables 6 and 7 ).
For both broadly neutralizing antibodies, there was an overall better fit to the stalk epitopes on H3 from the imprinting strain relative to H1 from the infecting strain, partially accounting for the H3-imprinting effects in a precursor–product manner.
Fig.
5: Asp46 in the HA stalk is a key residue to recall responses of H3-imprinted cross-group memory B cells.
a , b , Cryo-EM maps and atomic models of d30_103 ( a ) and d30_240 ( b ) in a complex with HK14 H3 and Mich15 H1 HAs.
c , d , Top-down cross-sectional views of the d30_103 ( c ) and d30_240 ( d ) complexes.
The Fv domains adopt different orientations due to Asn38 and Asn33 glycans near the epitopes on HK14 H3 and Mich15 H1, respectively.
The black lines connect conserved Cys residues of the heavy and light chains to visualize Fv angles and relative orientation.
e , f , Epitopes of d30_103 ( e ) and d30_240 ( f ) mapped onto the HA surface; involved CDR and FR loops are indicated.
BSA, buried surface area.
g , h , Detailed interactions of d30_103 ( g ) and d30_240 ( h ) around HA2 helix A.
The dashed lines indicate hydrogen bonds and salt bridges.
The interacting residues of each antibody are numbered according to the Kabat numbering scheme.
i , j , Epitope conservation of d30_103 and d30_240 based on human seasonal H3N2 (1968–2024; i ) and H1N1 (1977–2024; j ) HA sequences.
Epitope residues involved in hydrogen bond or salt-bridge interactions are indicated.
k , The natural occurrence frequencies of amino acid variants at position 46 of HA2 in H1 (1918–1957; 1977–2024) and H3 (1968–2024) by year.
l , The K d of 15 neutralizing cross-group monoclonal antibodies (IgGs) from the H3–H1 group of children against NC99 H1 wild type (WT) and NC99 H1 N46D mutant HAs.
m , Summary data of l ; increase or decrease in apparent affinity is indicated by colour.
All values higher than 10,000 nM were categorized as negative and replaced by 20,000 nM.
Mean is shown as a straight line.
The results in l and m represent the average of two technical replicates from one out of the two independent experiments for n = 15 monoclonal antibodies.
Statistical analysis was performed using two-sided Wilcoxon matched-pairs signed-rank tests.
n , o , Interaction networks and contact probabilities between paratope residues of d30_103 ( n ) and d30_240 ( o ) and HA2 residue 46 from molecular dynamics (MD) simulations of the Mich15 H1 (Asp46) complex and the NC99 H1 (Asn46) model structure.
p , q , Contact frequencies ( p ) and electrostatic interaction energies ( q ) from MD simulations.
Source data Full size image
a , b , Cryo-EM maps and atomic models of d30_103 ( a ) and d30_240 ( b ) in a complex with HK14 H3 and Mich15 H1 HAs.
c , d , Top-down cross-sectional views of the d30_103 ( c ) and d30_240 ( d ) complexes.
The Fv domains adopt different orientations due to Asn38 and Asn33 glycans near the epitopes on HK14 H3 and Mich15 H1, respectively.
The black lines connect conserved Cys residues of the heavy and light chains to visualize Fv angles and relative orientation.
e , f , Epitopes of d30_103 ( e ) and d30_240 ( f ) mapped onto the HA surface; involved CDR and FR loops are indicated.
BSA, buried surface area.
g , h , Detailed interactions of d30_103 ( g ) and d30_240 ( h ) around HA2 helix A.
The dashed lines indicate hydrogen bonds and salt bridges.
The interacting residues of each antibody are numbered according to the Kabat numbering scheme.
i , j , Epitope conservation of d30_103 and d30_240 based on human seasonal H3N2 (1968–2024; i ) and H1N1 (1977–2024; j ) HA sequences.
Epitope residues involved in hydrogen bond or salt-bridge interactions are indicated.
k , The natural occurrence frequencies of amino acid variants at position 46 of HA2 in H1 (1918–1957; 1977–2024) and H3 (1968–2024) by year.
l , The K d of 15 neutralizing cross-group monoclonal antibodies (IgGs) from the H3–H1 group of children against NC99 H1 wild type (WT) and NC99 H1 N46D mutant HAs.
m , Summary data of l ; increase or decrease in apparent affinity is indicated by colour.
All values higher than 10,000 nM were categorized as negative and replaced by 20,000 nM.
Mean is shown as a straight line.
The results in l and m represent the average of two technical replicates from one out of the two independent experiments for n = 15 monoclonal antibodies.
Statistical analysis was performed using two-sided Wilcoxon matched-pairs signed-rank tests.
n , o , Interaction networks and contact probabilities between paratope residues of d30_103 ( n ) and d30_240 ( o ) and HA2 residue 46 from molecular dynamics (MD) simulations of the Mich15 H1 (Asp46) complex and the NC99 H1 (Asn46) model structure.
p , q , Contact frequencies ( p ) and electrostatic interaction energies ( q ) from MD simulations.
We next examined the role of specific contact residues in the loss of reactivity to pre-pdm H1N1 strains by cross-group broadly neutralizing antibodies from the H3–H1 group of children (Fig.
4a,d ).
Conservation analysis of the H1 epitopes bound by broadly neutralizing antibodies d30_103 and d30_240 showed that only Val18, Leu38 and Asp46 in HA2 were substituted in many H1N1 strains circulating over the past several decades (Fig.
5j ).
Among these, only Asp46 formed both van der Waals contacts and an extensive hydrogen bond network with heavy-chain residues of the two broadly neutralizing antibodies in both H3 and H1 complexes (Fig.
5i,j and Supplementary Tables 6 and 7 ).
Approximately 21% of H3N2 strains (1968–2024) and 37% of H1N1 strains (1977–2024) included in the conservation analysis carry an Asn residue at this position (Fig.
5i,j ).
Selective pressure from pre-existing antibodies can drive viral evolution and select for single amino acid substitutions that enable viral escape from the cross-group stalk epitope 38 , including an HA2 D46N substitution that affects binding to H3 and H1 viruses 39 , 40 .
Thus, it stands to reason that HA2 Asp46 could be a crucial contact residue for cross-group antibody binding to the stalk and imprinting future immune memory.
Notably, the pre-pdm H1N1 strains tested for binding, including A/USSR/90/1977, NC99 and A/Brisbane/59/2007, as well as an H3N2 strain (A/Wisconsin/67/2005) that bnAb d30_103 failed to bind to, all carried an Asn residue at HA2 position 46 (Fig.
4a and Extended Data Fig.
8a ).
While most H1N1 strains before the 2009 pandemic have HA2 Asn46, 2009-pandemic and descendant strains all have HA2 Asp46 (Fig.
5k ).
For H3N2 strains, position HA2 46 has been predominantly fixed as an Asp residue since 2006, before the children in the H3–H1 group were born (Fig.
5k ).
Together, these results suggest a key role for Asp46 in imprinting the cross-group stalk epitope.
To validate this role, we introduced an HA2 N46D mutation into NC99 H1, which most H3-imprinted broadly neutralizing antibodies failed to bind to, and an HA2 D46N mutation into Mich15 H1, which was bound by all H3-imprinted broadly neutralizing antibodies (Fig.
4a ).
Indeed, Asp46 was important for binding, as 87% (13 out of 15) of the broadly neutralizing antibodies from the H3–H1 group of children showed increased apparent affinity to NC99 H1 N46D (0.99±1.1 μM) compared with wild-type NC99 H1 (11.6 ± 9.3 μM), and 73% (11 out of 15) showed decreased apparent affinity to Mich15 H1 D46N (6.7 ± 9.7 μM) compared with wild-type Mich15 H1 (0.25 ± 0.49 μM) (Fig.
5l,m and Extended Data Fig.
8c,d ).
Binding of the predicted germline precursors of H3-imprinted broadly neutralizing antibodies to H1 HAs of subsequent infecting Mich15 and unrelated NC99 was also dependent on Asp46, indicating a germline predisposition (Extended Data Fig.
8e ).
Consistent with these results, all seven broadly neutralizing antibodies lacking NC99 H1 binding had binding rescued by an N46D substitution and showed a significant loss of binding to A/South Carolina/1/1918 H1 with a D46N exchange (Extended Data Fig.
8f ).
Molecular dynamics simulations using our Mich15 H1 complex structures and previously generated NC99 H1 complex structures showed that residues Thr28, Asn31 and Tyr32 in the heavy chain of bnAb d30_103 and Arg99 in the CDR-H3 of bnAb d30_240 had higher contact frequencies and stronger electrostatic interaction energies with Asp46 in Mich15 H1 than with Asn46 in NC99 H1 (Fig.
5n–q ).
These results suggest that the D46N substitution weakens the binding of H3-imprinted broadly neutralizing antibodies to the HA stalk of pre-pdm H1N1 strains by reducing favourable contacts and electrostatic interactions.
The two residues diverge by only a functional group on their side chains, differing only in the atom bound to the carbonyl carbon, where Asp has a carboxylic acid group (-COOH) and N has an amide group (-CO-NH 2 ) (Extended Data Fig.
8b ).
Although only a single atomic group is involved, this difference probably has a disproportionate effect on antibody binding and imprinting due to the shift in charge.
Collectively, these results show that an Asp46 residue in the HA stalk epitopes of imprinting H3N2 strains and later-infecting H1N1 strains was key to the selection.
Recall of most cross-reactive memory B cells in the H3–H1 group of children resulted in a major loss of breadth to H1 strains with Asn46.
Avoidance of heterosubtypic imprinting
Here we investigated the origins of immune imprinting by examining B cell responses to sequential first exposures to antigenically divergent influenza virus strains in young children.
Beyond being primary responses with subtle variations in gene expression patterns, no major differences were noted in B cells at the level of transcriptome clustering that predisposed children to imprinting.
Future analyses of larger datasets may resolve rare transcriptional clusters and the evaluation of cell-surface protein markers not evident by transcriptional analysis alone may be informative.
Compared with the primary responses of children, adult B cells showed substantially more backboosting and a stereotyped IgV gene repertoire with more SHMs, suggesting substantial imprinting.
Subtype specificities of predicted germline broadly neutralizing antibodies corroborated excessive imprinting of the adult repertoires, showing varied origins of birth-year strains, including a third to H2, which has not circulated since 1968.
These distinctions suggest that widespread homosubtypic and heterosubtypic imprinting impact the B cell responses to influenza viruses in adults.
Sequential heterosubtypic infections in children led to targeting of the highly conserved HA central stalk epitope by cross-group MBCs.
Affinity bias and germline targeting of the first infecting strains, with accumulating SHMs, corroborated this finding.
These imprinted B cells exhibited deleterious shifts in reactivity and breadth, with reduced affinity and neutralization potency.
Structural analyses showed that a single amino acid (HA2 Asp46) was the primary contact residue mediating binding to the H3-imprinting strain and to subsequent infecting H1 strains.
Most pre-pdm H1N1 strains have Asn46 rather than Asp, differing by a single atomic group, which promoted a nearly universal shift in the functions of B cell memory to the important HA stalk epitope.
In contrast to most B cells targeting the H1 stalk, these H3-imprinted B cells have a major gap in coverage to most pre-pdm H1N1 strains and show reduced activity against pdm-H1N1 strains.
Cross-group anti-stalk antibodies from adults were unimpaired, including those from similar public anti-stalk classes (that is, VH1-18 encoded).
This suggests that, with additional or repeated exposures to H1 strains, H3-imprinted B cells may be outcompeted or adapt through accumulating somatic mutations to acquire broader reactivity.
Importantly, the reactivity of cross-group anti-stalk B cells appeared unimpaired after primary vaccination with both H1 and H3 strains simultaneously.
However, a previous study showed that influenza infection had a greater impact on establishing the memory B cell repertoire than vaccination 32 , warranting further study.
As the imprinting-mediated reactivity shift was observed in most cross-group anti-stalk antibodies isolated from seven children, we conclude that even minor differences in the molecular structures of antigens encountered can substantially affect memory recall responses to particular epitopes.
Thus, with a widespread focus on targeting only a few broadly conserved epitopes in the influenza vaccine field, such effects at each individual epitope level are of central concern.
Serum and peripheral blood mononuclear cell (PBMC) samples were obtained from participants enrolled in two prospective community-based studies in Nicaragua: The Household Influenza Transmission Study (HITS) and the Nicaraguan Pediatric Influenza Cohort Study (NPICS).
HITS is an intensive transmission study that enrols households after identification of a laboratory-confirmed influenza case and conducts intensive follow-up of household members.
NPICS is an ongoing, longitudinal cohort of children aged 0–14 years, established to study the development of immunity to influenza from birth through annual serosurveys and active surveillance for acute respiratory illness.
The sample sizes were not predetermined by statistical methods.
These are observational studies, so no blinding or randomization was used.
PBMCs were isolated from venous blood by density-gradient centrifugation and cryopreserved for subsequent cellular immunology assays, as previously described 41 .
NPICS samples were collected during the 2017–2018, 2018–2019, 2019–2020 and 2022–2023 seasons, whereas HITS samples were collected during the 2015–2016 season in Nicaragua, which typically spans June to December each year.
These samples represent both the pre-infection (0–3 days between symptom onset) and post-infection (4–8 weeks after symptom onset) timepoints, enabling characterization of immune responses across the course of infection in a well-defined community setting.
Written informed consent was obtained from parents or legal guardians of all participants, with assent from children as appropriate.
Both studies received ethical approval from institutional review boards in Nicaragua and at the University of Michigan (HUM00091392 and HUM00088895).
Healthy infants for analysis of immune responses to primary influenza vaccination were recruited at paediatric primary clinics at Nationwide Children’s Hospital (NCH), Columbus, Ohio.
Sera and PBMCs were collected after 1 month of vaccination as described above.
The sample sizes were not predetermined by statistical methods, and no blinding or randomization was used.
Written informed consent was obtained from parents or guardians before any of the study procedures.
The study was approved by the NCH IRB (18-00591).
Madin–Darby canine kidney (MDCK) cells were purchased from ATCC and maintained in culture at 37 °C with 5% CO 2 in Dulbecco’s modified Eagle’s medium (DMEM, Gibco) supplemented with 10% FBS (Gibco), 1% l -glutamine (Gibco) and 1% penicillin–streptomycin (final concentration, 100 units ml −1 penicillin, 100 μg ml −1 streptomycin, Gibco).
Humanized MDCK (hCK) cells 42 (in-house cell line generated by the Kawaoka laboratory) were maintained in culture at 37 °C with 5% CO 2 in minimum essential medium (MEM, Gibco) containing 5% (v/v) newborn calf serum (Sigma-Aldrich), 0.225% sodium bicarbonate (Corning), 1× amino acids (Gibco), 1× vitamins (Gibco), 1× anti-anti (Gibco), 4 mM l -glutamine (Gibco), 2 μg ml −1 puromycin (InvivoGen) and 10 μg ml −1 blasticidin (InvivoGen).
Expi293F suspension cells were purchased from Thermo Fisher Scientific and maintained in culture at 37 °C with 8% CO 2 in Expi293F Expression Medium (Gibco) with shaking at 125 rpm.
Cell lines were not authenticated or tested for mycoplasma at the lab level.
Influenza viruses were grown in-house in MDCK cells or specific-pathogen free (SPF) eggs, collected, purified and titred (Supplementary Table 9 ).
Recombinant antigen and probe production
HA ectodomain sequences were synthesized by Integrated DNA Technologies (IDT) and cloned into a mammalian protein expression vector with a C-terminal foldon trimerization domain followed by AviTag and 6×His tag.
Constructs were transfected using the ExpiFectamine 293 kit (Gibco) according to the manufacturer’s protocol.
Supernatants were collected on day 5 after transfection and incubated with Ni 2+ -nitrilotriacetic acid (Ni-NTA) agarose (Qiagen).
Agarose was then loaded onto a polypropylene gravity flow column (Thermo Fisher Scientific), washed with 20 mM imidazole in PBS and eluted with a solution of 500 mM imidazole, 20 mM Tris and 150 mM NaCl at pH 7.4.
The eluate was buffer exchanged with PBS using a 100 kDa Amicon centrifugal column (Millipore).
Purified HA proteins were stored at −80 °C (Supplementary Table 8 ).
For probes used in cell sorting, a Y98F mutation was introduced into all HA constructs, and constructs of the SARS-CoV-2 WT (D614G) receptor-binding domain (RBD) and chimeric HAs were generated as previously described 43 , 44 .
All probes were synthesized, cloned, expressed and purified as described above.
The purified probes were biotinylated (AviTag-specific) with BirA enzyme according to the manufacture’s protocol (Avidity).
The unreacted biotin was removed by passage through a 7 kDa molecular mass cut-off desalting column (Zeba spin, Thermo Fisher Scientific).
Biotinylated HAs were conjugated to TotalSeq-C PE streptavidin (PE-SA, BioLegend) and BV421 streptavidin (BV421-SA, BioLegend), whereas SARS-CoV-2 WT RBD was conjugated to APC streptavidin (APC-SA, BioLegend).
Chimeric HAs (cH8/1 or cH4/3) and an empty control (no antigen, PBS only) were conjugated to TotalSeq-C non-fluorescent streptavidin (NF-SA, BioLegend).
The amount of antigen needed for conjugation was calculated based on a 4:1 molar ratio of antigen to a fixed amount of 0.5 μg PE-SA, BV421-SA, APC-SA or NF-SA.
Antigens were diluted in PBS to a final volume of 10 μl and SAs were added gradually to antigens five times on ice, 1 μl SA (0.1 mg ml −1 stock) every 10 min for a total of 5 μl (0.5 μg).
The reaction was quenched with 5 μl 4 mM Pierce Biotin (Thermo Fisher Scientific) for 30 min for a total volume of 20 μl.
Probes used for each sorting experiment were prepared on the same day.
Cell sorting for 10x Genomics single-cell sequencing
PBMCs were thawed and 0.5 million cells from each individual were aliquoted.
The remaining PBMCs from each participant were pooled together for B cell enrichment using EasySep pan B cell magnetic enrichment kit (StemCell Technologies).
Enriched B cells were stained with CD19 PE-Cy7 (BD Biosciences), TotalSeq-C CD79b (BioLegend) and antigen probes (HA-PE-SA, HA-BV421-SA, RBD-APC-SA, chimeric HA/empty-NF-SA) at 1:100 dilution in fluorescence-activated cell sorting (FACS) buffer (PBS supplemented with 2% FBS and 2 mM Pierce Biotin) on ice for 30 min.
B cells were washed twice with FACS buffer and stained with 7-AAD viability staining solution (BioLegend).
Populations that were 7-AAD − CD19 + APC − PE + BV421 + were sorted as HA-specific B cells on the BD FACSMelody cell sorter (BD Biosciences).
An aliquot of 0.5 million PBMCs from each individual was stained with CD19 PE-Cy7, CD4 BB515 (BD Biosciences) and a unique TotalSeq-C anti-human hashtag (BioLegend) at 1:100 dilution in FACS buffer on ice for 30 min.
Aliquots were washed twice with FACS buffer and subsequently pooled together before staining with 7-AAD.
Populations that were 7-AAD − CD19 + were sorted as CD19 + B cells.
To account for low cell numbers, several thousands of CD4 + T cells from pooled PBMCs were sorted and mixed into HA-specific B cells as carrier cells.
PBMCs from acute or convalescent timepoints were processed and sorted separately.
Sorted cells were immediately loaded onto the 10x Chromium X Controller to generate single-cell gel-beads in emulsion (GEM) using Chromium Next GEM Single Cell 5′ HT Reagent kits v2 (10X Genomics).
10x single-cell libraries of 5′ Gene Expression, V(D)J BCR and feature barcode (cell surface protein) were prepared according to the manufacturer’s user guide (CG000424 Rev B).
Libraries were pooled and sequenced using NextSeq 1000/2000 P2 XLEAP-SBS Reagent Kit (300 cycles) on the NextSeq 1000 platform (Illumina) with the configuration of 26 cycles for read 1, 10 cycles for i7/i5 index and 150 cycles for read 2.
Computational analysis for single-cell sequencing data
Libraries of 5′ gene expression, V(D)J BCR and feature barcodes were demultiplexed using the cellranger mkfastq pipeline.
FASTQ reads were mapped to the human genome (GRCh38-2020-A) either using a combination of cellranger_count and cellranger_vdj, or cellranger_multi (v.7.0.1 or newer).
Downstream analyses were performed in R v.4.2.2 using Seurat (v.4.3.0 or newer), including quality control, data normalization, data scaling, dimension reduction (both linear and nonlinear), clustering, differential expression analysis, batch-effect correction, data visualization, and UMAP generation.
Quality-control thresholds for each dataset were determined based on the distributions of detectable gene numbers (remove outliers with <200 or >3,000–5,000 based on dataset) and the percentage of mitochondrial genes (remove outliers with >5–10% based on the dataset).
The donor identity of each cell was determined using an in-house hybrid demultiplexing approach that integrated results of cell hashing (hashtag) and a single-nucleotide-polymorphisms-based demultiplexing method (Souporcell) as previously described 45 .
The following cells were filtered out: cells classified as doublets or unassigned based on hybrid demultiplexing; outliers in the distribution of detectable gene numbers or percentage of mitochondrial genes; and cells not expressing CD79A or expressing any of the non-B cell markers (LYZ, CD14, CD8A, GNLY, PPBP, CD3E, FCER1A, FCGR3A).
Transcriptome data were normalized using a log-transform function with a scaling factor of 10,000, whereas cell surface protein data (TotalSeq antibody and antigen probe) were normalized using centred log-ratio normalization.
Batch-effect correction analysis was performed using an Anchor method implemented in Seurat.
After integration, we performed data scaling and linear dimension reduction using variable genes in principal component analysis and the top 15 principal components.
High-quality cells were then clustered using the Louvain algorithm implemented in Seurat under a resolution of 0.6.
Cells were clustered using the FindNeighbors and FindClusters functions.
Further dimension reduction and visualization were performed using the RunUMAP function.
DEGs for each cell cluster were identified using a Wilcoxon rank-sum test implemented in Seurat.
B cell subset identity was assigned to each cluster based on DEGs and expression of stereotypical gene markers.
We performed GSEA with DEGs from a putative recent GC emigrant cluster using the fgsea package v.1.24.0.
Published gene sets were used for GSEA and relevant biological processes with adjusted P < 0.01 and normalized enrichment score > 2 were plotted (Extended Data Fig.
3h ).
Single-cell BCR-sequencing analysis
Full-length V(D)J contigs were assembled with cellranger_vdj or cellranger_multi (v.7.0.1 or newer) and aligned to IMGT reference using IgBLAST v.1.20.0.
The downstream analyses and annotations were done using an in-house single-cell multi-model analysis software VGenes ( https://wilsonimmunologylab.github.io/VGenes/ ).
Cells with ‘good BCR’ were filtered using the following criteria: cells passed the transcriptome quality control, V(D)J information is available for one heavy chain paired with one light chain, classified as full-length and productive by VGenes.
Chord plots for B cell repertoires were generated in R using chordDiagram function of circlize package v.0.4.16.
Antigen specificity prediction through probe score
Unnormalized UMI counts were extracted from the Seurat ADT assay for cells with ‘good BCR’.
A probe score for each antigen was calculated as the UMI ratio of antigen to CD79b and an empirical cut-off of 0.1 was set to distinguish positive from negative.
UMI ratios shown in probe score heat maps were log 2 -transformed for better visualization.
To account for the dilution effect in UMI per antigen for cells reactive to multiple antigens, cells were considered to be positive for a given subtype (H1 or H3) when the sums of probe scores of all HAs from the same subtype were higher than 0.1.
Subtype reactivity of each cell was determined based on the following criteria: (1) cells positive for H1 were identified as H1 reactive; (2) cells positive for H3 were identified as H3 reactive; (3) cells with UMI > 0 for at least two antigens from each subtype and positive for both H1 and H3 were identified as H1/H3 cross-reactive; (4) cells positive for the empty probe (no antigen) were identified as polyreactive; (5) cells positive for neither H1 or H3 were identified as non-reactive.
Cells belonging to the polyreactive, or nonreactive category, were considered non-specific and removed from the dataset of HA-specific B cells.
Within H1-reactive cells, stalk binders were identified when scores of chimeric H1 (cH8/1) were higher than the mean scores plus 3 s.d.
of all H1 probes, while head binders were identified otherwise.
The predicted antigen specificities of subsets of B cells were validated with corresponding monoclonal antibodies by ELISA.
High-protein-binding microtitre plates (Costar) were coated with recombinant HA antigens at 2 μg ml −1 in PBS overnight at 4 °C.
The plates were washed three times with PBS containing 0.05% Tween-20 (PBS-T) and incubated with 200 μl blocking buffer (PBS containing 0.1% Tween-20 and 3% skimmed milk powder) for 1 h at room temperature.
Serums were threefold serially diluted in dilution buffer (PBS containing 0.1% Tween-20 and 1% skimmed milk powder) starting at 1:100.
Plates were incubated with 100 μl serum dilutions for 2 h at room temperature.
Horseradish peroxidase (HRP)-conjugated goat anti-human IgG secondary antibody (Sigma-Aldrich) was diluted at 1:3,000 in dilution buffer.
The plates were incubated with 100 μl secondary antibody dilutions for 1 h at room temperature.
Plates were washed three times with PBS-T and developed with 100 μl SigmaFast o -phenylenediamine dihydrochloride solution (Sigma-Aldrich) for 10 min in the dark.
An additional 50 μl 3 M hydrochloric acid was added to stop the development reaction.
Absorbance was measured at 490 nm on a microplate spectrophotometer (Bio-Rad).
The area under the curve (AUC) for each serum sample was calculated in GraphPad Prism 10.
The limit of detection was calculated as mean absorbance plus 3 s.d.
of serum at the acute timepoint from H1-only children who were previously naive to influenza.
All AUCs below the limit of detection were replaced by a fixed value of 15.
Recombinant monoclonal antibody and Fab production
Subsets of HA-specific B cell clones with ‘good BCR’ from different cohort groups or timepoints were randomly selected for monoclonal antibody expression.
Notably, all H1/H3 cross-reactive clones were selected to enrich sample size for memory recall response.
The immunoglobulin heavy and light chain sequences of these clones were synthesized as gene fragments by IDT or Twist Bioscience.
To generate germline version of monoclonal antibodies, the variable regions of each clone were aligned to IMGT reference using IgBLAST v.1.20.0 and somatic mutations in heavy and light chains were both reverted.
Unmapped nucleotides in CDR3 junctions were replaced with sequences of affinity-matured antibodies.
Synthesized gene fragments were cloned into human IgG1, human κ or human λ expression vectors.
The heavy and light chain constructs of each monoclonal antibody were transiently co-transfected into Expi293F cells using polyethylenimine (Polyscience).
The supernatants containing secreted monoclonal antibodies were collected on day 5 and purified using protein A-agarose beads (Thermo Fisher Scientific) as described previously 46 .
To generate Fab, the heavy-chain fragments of selected monoclonal antibodies were inserted into a modified human IgG1 vector with Fc constant region replaced by 6×His tag.
The Fab version heavy chain and corresponding light-chain constructs were co-transfected and secreted Fabs within supernatants were purified according to the same protocol for purifying recombinant antigen, as described above, except that the buffer exchange was done using a 10 kDa Amicon centrifugal column.
Antigen-specific high-avidity ELISA
High-protein-binding microtitre plates were coated with recombinant monoclonal antibodies at 2 μg ml −1 in PBS overnight at 4 °C.
Plates were washed three times with PBS-T and blocked with 150 μl PBS containing 20% FBS for 1 h at 37 °C.
Antigen probes were generated as described before with unconjugated streptavidin (Invitrogen) and serially diluted 1:3 starting at 30 μg ml −1 .
The plates were incubated with 50 μl of probe dilutions for 1 h at 37 °C.
HRP-conjugated rabbit anti-streptavidin polyclonal antibody was diluted 1:1,000 (Abcam) and 70 μl of antibody dilution was used to detect binding of probes.
The plates were washed three times with PBS-T and subsequently developed with Super Aquablue substrate (eBiosciences).
The absorbance was measured at 405 nm on a microplate spectrophotometer (Bio-Rad).
Control antibodies with known binding characteristics were included on each plate and results were recorded when the absorbance of control reached 1.0 optical density (OD) units.
High-protein-binding microtitre plates were coated with 50 µl of A/Michigan/45/2015 HA at a concentration of 1 µg ml −1 and incubated overnight at 4 °C.
Monoclonal antibodies with known epitope specificities were incubated at room temperature with EZ-Link Sulfo-NHS-Biotin (Thermo Fisher Scientific) for 4 h to be biotinylated and the unreacted biotin was removed by passage through a 7 kDa molecular mass cut-off desalting column (Zeba spin, Thermo Fisher Scientific).
After blocking the plates with PBS containing 20% FBS for 1 h at 37 °C, 50 µl of each competing monoclonal antibody serially diluted at 1:2 ratio starting at 200 μg ml −1 was added in the coated wells for 2 h at room temperature.
Then, 50 µl of each biotinylated monoclonal antibody was added at a concentration equal to twice its K d and incubated in the wells with the competing monoclonal antibodies for 2 h at room temperature.
After washing the plates three times with PBS-T, the wells were incubated with 100 µl of 1:1,000 diluted HRP-conjugated streptavidin (Southern Biotech) at 37 °C for 1 h.
Super Aquablue ELISA substrate (eBiosciences) was then added, and the absorbance was measured at 405 nm on a microplate spectrophotometer (Bio-Rad).
Biotinylated monoclonal antibodies were incubated in designated wells on each plate without any competing monoclonal antibody, and data were recorded when the absorbance of these wells reached an OD of 1–1.5 units.
After subtracting the background, the percentage competition of each well was calculated by dividing the observed OD of that well by the OD reached by the positive control, subtracting this value from 1, and multiplying by 100.
Focus reduction neutralization test
The day before the experiment, 25,000 MDCK cells were added to each well of a 96-well plate.
Serial threefold dilutions of monoclonal antibody in 50 μl MEM, starting at 200 μg ml −1 , were mixed with an equal volume of 100 focus-forming units of virus for 1 h at 37 °C and added to MDCK cells.
Overlay was prepared by mixing 50 μl 2% methylcellulose (Sigma-Aldrich) and an equal volume of monoclonal antibody dilutions in MEM supplemented with 1 μg ml −1 tosyl phenylalanyl chloromethyl ketone (TPCK)-treated trypsin.
The virus–antibody mixture was removed after 1 h of incubation.
The 100 μl overlay was added to cells and the plates were incubated for 20 h at 37 °C.
Cells were washed with PBS, fixed with 100 μl 80% ice-cold acetone at −20 °C for at least 1 h and blocked for 30 min with 100 μl staining buffer (PBS containing 3% FBS).
Cells were incubated with 100 μl mouse anti-NP antibody (clone A3, Millipore) diluted 1:1,000 in staining buffer, followed by 100 μl goat anti-mouse IgG HRP (Southern Biotech) diluted 1:1,000 in staining buffer for 1 h at room temperature.
The plates were then washed three times with PBS and developed with 50 μl TrueBlue peroxidase substrate (SeraCare Life Sciences) in the dark for 5 min.
Quantification of viral foci was performed using the S6 Universal M2 reader (ImmunoSpot).
The inhibition percentage was calculated as: ((virus-only foci − sample foci)/virus only foci) × 100.
The IC 50 or FRNT 50 for monoclonal antibodies was determined using the log[inhibitor] versus normalized response (variable slope) analysis in GraphPad Prism 10.
MI15 H1, HK14 H3, NC99 H1, NC99 H1 N46D or MI15 H1 D46N were biotinylated and loaded at a concentration of 40 μg ml −1 onto a streptavidin biosensor (Forte Bio/Sartorius) for 300 s.
After the sensor was equilibrated in kinetic buffer (PBS containing 0.02% Tween-20 and 0.1% bovine serum albumin) for 60 s, the sensor was first soaked into 500 nM Fab or IgG for 150 s as an association step and then soaked into kinetic buffer for 150 s as a dissociation step.
The K d of each Fab or IgG was calculated using Octet Analysis Software v.12.2.2.26 (Forte Bio/Sartorius).
Results with coefficient of determination ( R 2 ) of <0.96 were removed and considered to be negative (no binding).
The HA sequences of five H1N1 A/Michigan/45/2015 mutants each with one major antigenic site (Sa, Sb, Ca1, Ca2, Cb) ablated were obtained from a previous study 47 .
The influenza eight-plasmid reverse genetics system 48 was used to construct the mutant viruses.
In brief, DNA plasmids of HA mutants were cloned into a pHW2000 vector and transfected into cocultured MDCK-SIAT cells and human embryonic kidney 293T cells with the other seven influenza segments of PR8.
After 72 h, the supernatants were collected.
Viruses were plaque purified on MDCK-SIAT cells grown in DMEM (Gibco) containing 10% FBS (Gibco) and penicillin–streptomycin mix (Gibco).
Individual plaques were picked and grown in fresh MDCK-SIAT cells.
To confirm the HA sequences of the viral mutants, viral RNAs were extracted from the supernatant and HA segments were amplified and confirmed by Sanger sequencing.
A/Michigan/45/2015 H1N1 wild-type or mutant viruses were diluted to eight HA units per 50 μl.
Then, 25 μl of the diluted virus was combined in duplicate wells with an equal volume of serially diluted monoclonal antibodies, starting from 100 μg ml −1 in PBS.
The virus–antibody mixture was incubated for 30 min at room temperature.
Next, 25 μl of 1% turkey red blood cells (Lampire) was added and incubated for 30 min at room temperature.
The minimum effective concentrations were read based on the final dilution at which haemagglutination was observed.
For the assay using A/Victoria/361/2011 H3N2 virus, the same protocol was followed using guinea pig red blood cells (Lampire) with monoclonal antibodies starting from 60 μg ml −1 .
The HA1 mutant library was generated in the background of H1N1 A/Michigan/45/2015 (Genbank: MK622940.1 , residues Leu87–Gly254) through saturation mutagenesis.
The linearized vector was generated from a pCTcon2 yeast display plasmid by using 5′-GGCCGGCTGGGCCGCTGCTAAAACTGAAGCAATAACAGAA-3′ and 5′-GGCCTCGGGGGCCTGTACCCATACGACGTTCCAGACTACG-3′ as primers.
Inserts were generated by two batches of PCRs, followed by overlapping PCRs.
The first batch of PCRs consisted of 21 reactions, each with an equal molar mix of eight primers as the forward primer and a universal reverse primer 5′-GCCTTCGCCGGAGCCTGGCTTGC-3′.
The forward primers for the first batch of PCRs are listed in Supplementary Table 10 .
These forward primers were named as cassetteX_N, in which X represents the cassette ID and N represents the primer number.
Forward primers with the same cassette ID were mixed at equal molar ratio and used in the same PCR.
The second batch of PCRs consisted of another 21 reactions, each with a universal forward primer 5′-ACCTCTATACTTTAACGTCAAGG-3′ and a unique reverse primer as listed in Supplementary Table 10 .
Subsequently, 21 overlapping PCRs were performed using the universal forward primer and the universal reverse primer.
For each overlapping PCR, the template was a mixture of 10 ng each of the corresponding products from the first and second batches of PCRs.
The complete insert was an equal molar mix of the products of these 21 overlapping PCRs.
All PCRs were performed using PrimeSTAR Max polymerase (Takara Bio) according to the manufacturer’s instructions.
PCR products were purified using the Monarch DNA Gel Extraction Kit (New England Biolabs).
Yeast cells were transformed by electroporation according to a previously described protocol 49 .
In brief, 5 μg of the HA1 insert library and 4 μg of the corresponding purified linearized vector were added into 400 μl of conditioned yeast.
The mixture was electroporated and transferred into yeast peptone dextrose medium supplemented with 4 ml of 1 M sorbitol and incubated at 30 °C with shaking at 225 rpm for 1 h.
Cells were plated onto synthetic dextrose casamino acid (SD-CAA) plates and incubated at 30 °C for 40 h.
Colonies were then collected in SD-CAA medium, centrifuged at 1,700 rcf for 5 min at room temperature and resuspended in SD-CAA medium with 15% (v/v) glycerol such that OD 600 was 50.
Glycerol stocks were stored at −80 °C until used.
A glycerol stock of the yeast display library was recovered in SD-CAA medium and induced in synthetic galactose raffinose casamino acid (SGR-CAA) medium.
We initially used APC anti-HA.11 (16B12, BioLegend) at a final concentration of 1 μg ml −1 to sort the yeast cells based on expression level.
After positive gating in the expression sort, PE-conjugated monoclonal antibodies were used at a final concentration of 10 μg ml −1 to gate the yeast cells for binding sort of HA1 variant library.
Using the BD FACSMelody Cell Sorter (BD Biosciences), yeast cells were gated by no HA1 expression (PE − APC − ), HA1 expression with no binding (APC + PE − ) and HA1 expression with binding (PE + APC + ).
The sorted cells were recovered in SD-CAA medium.
Frozen stocks were made and stored at −80 °C until used.
FlowJo v.10.8 software (BD Life Sciences) was used to analyse FACS data.
Plasmids from the yeast cells were extracted using a Zymoprep Yeast Plasmid Miniprep II Kit (Zymo Research) according to the manufacturer’s protocol.
The HA1 mutant library was amplified by PCR using forward recovered primers 5′-CACTCTTTCCCTACACGACGCTCTTCCGATCTTCCTGGGAAATCCAGAGTGTGA A-3′ and reverse recovered primers 5′-GACTGGAGTTCAGACGTGTGCTCTTCCGATCTCCAGTTGCTTCGAATGTTATTTT-3′.
Subsequently, adapters containing sequencing barcodes were appended to the amplicon using primers 5′-AATGATACGGCGACCACCGAGATCTACACXXXXXXXXACACTCTTTCCCTACACGACGCT-3′ and 5′-CAAGCAGAAGACGGCATACGAGATXXXXXXXXGTGACTGGAGTTCAGACGTGTGCT-3′.
Positions annotated by an X represented the nucleotides for the index sequence.
All PCRs were performed using Q5 High-Fidelity DNA polymerase (NEB) according to the manufacturer’s instructions.
PCR products were purified using PureLink PCR Purification Kit (Thermo Fisher Scientific).
The final PCR products were submitted for next-generation sequencing using MiSeq v.3 PE300 (Illumina).
Next-generation sequencing data were obtained in FASTQ format.
Forward and reverse reads of each pair-end read were merged by PEAR 50 .
The merged reads were parsed by SeqIO module in BioPython 51 .
Primer sequences were trimmed from the merged reads.
Trimmed reads with lengths inconsistent with the expected length were discarded.
The trimmed reads were then translated to amino acid sequences, with sequencing error correction performed at the same time as previously described 52 .
The number of reads corresponding to each HA1 variant in each sample is counted.
The frequency ( F ) of a mutant i at position s within bin n of replicate k was computed for each replicate as follows:
A pseudocount of 1 was added to the read counts of each mutant to avoid division by zero in subsequent steps.
We then calculated the HA1 expression ratio (ER) of a mutant i at position s of replicate k as follows:
Subsequently, we calculated the escape score (ES) of each mutant i at position s of replicate k as follows:
The expression score of a mutant i at position s of was then calculated by taking the average of the expression scores between replicates.
In the HA1 yeast display library, structural destabilizing mutations could potentially impact the interaction between HA and all three tested antibodies.
This would lead to high escape score for some mutations, despite not being part of the epitope 53 .
Two antibodies, Hb-9 and Hb-5, have been used as control in the experiments.
Notably, antibody Hb-5 binds to Sa only and Hb-9 does not bind to any of five immunodominant sites.
Based on our mutant virus HAI experiments, we inferred that their binding epitopes differed from one another.
Therefore, to mitigate the effects of these destabilizing mutations, we determined the final escape score (FES) of each mutant i at position s of replicate k by subtracting its average escape score against all five tested antibodies, as destabilizing mutations are more likely to exhibit high escape score across all five screens:
To overlay the epitope of each antibody onto the HA structure, the average final escape score of position s was then calculated by taking the average of the final escape score of all mutants at that position:
The average final escape scores of each antibody were then projected onto the cryo-EM structure of A/Michigan/45/2015 HA (PDB: 6XGC ).
Twofold serial dilutions of the monoclonal antibodies (ranging from 480 μg ml −1 to 0.23 μg ml −1 ) were performed in MEM supplemented with 0.3% (v/v) bovine serum albumin and 0.00006% (v/v) TPCK.
Each dilution was mixed with equal volume of 100 tissue culture infectious doses 50 (TCID 50 ) of virus (so that the final monoclonal antibodies concentrations range from 240 μg ml −1 to 0.12 μg ml −1 ) and incubated at 37 °C for 1 h.
The monoclonal antibody–virus mixtures were inoculated into MDCK cells (for avian viruses and H1N1 viruses) or hCK cells (for H3N2 viruses) in quadruplicates in a 96-well plate and incubated at 39 °C (for avian viruses) or 37 °C (For H1N1 and H3N2 viruses) with 5% CO 2 for 5 days.
The IC 50 values were calculated according to the Reed–Muench method based on the observed cytopathic effect in the inoculated cells.
All mice were housed (12 h–12 h light–dark cycle, 20–24 °C, 45–65% humidity) for at least 1 week before any experiments.
1 mg per kg of monoclonal antibody cocktails were intraperitoneally transferred into 6–8-week-old female BALB/c mice (Jackson Laboratories).
1 mg per kg of an irrelevant anti-RBD antibody (S728_1157) was also transferred into mice as an isotype (IgG) control to detect any non-specific protection.
All antibodies were transferred 2 h before infection as a prophylactic treatment.
Mice from each group ( n = 5) were anaesthetized with a ketamine xylazine mixture and infected intranasally with 5 LD 50 of mouse-adapted A/New Caledonia/20/1999 H1N1 virus, A/New York City/PV63249/2022 H1N1 virus or A/New York City/PV63311/2022 H3N2 virus in a total volume of 50 µl PBS.
Mice were weighed daily for 14 days after infection; those losing 25% of their initial bodyweight were humanely euthanized.
A sample size of five mice per condition was used based on a previously performed power analysis.
Mouse challenge experiments were not blinded or randomized.
All experiments were conducted according to protocols approved by the Icahn School of Medicine at Mount Sinai Institutional Animal Care and Use Committee (IACUC).
Cryo-EM sample preparation and data collection
Purified d30_103 and d30_240 Fabs were mixed with HK14 H3 HA and Mich15 H1 HA, respectively, at a molar ratio of 1:2 (HA protomer:Fab), and incubated at room temperature for 1 h before grid preparation.
The final concentration of HA in each sample ranged from 0.7 to 0.8 mg ml −1 .
The samples were mixed with octyl-β-glucoside (OBG; final concentration 0.1%, w/v) to aid particle tumbling and applied to Quantifoil 1.2/1.3 300 mesh copper grids.
Grids were plunge-frozen in liquid ethane using the Vitrobot Mark IV (Thermo Fisher Scientific) with a blot force of 1 and a blot time of 4–4.5 s at 100% humidity and 4 °C.
Micrographs for the d30_103-HK14 H3 and d30_240-HK14 H3 complexes were collected on a Glacios 2 microscope (Thermo Fisher Scientific) operating at 200 kV with a Falcon 4i direct electron detector, while micrographs for the d30_103-Mich15 H1 and d30_240-Mich15 H1 complexes were collected on the Glacios microscope equipped with a Falcon IV detector.
Automated data collection was carried out using EPU (Thermo Fisher Scientific) at a nominal magnification of 190,000, with a total exposure dose of around 45 e − Å −2 .
The pixel size was 0.718 Å for the HK14 H3 datasets and 0.725 Å for the Mich15 H1 datasets, with a nominal defocus range of −0.6 to −1.4 μm and −0.7 to −1.4 μm, respectively.
The purified H1N1 A/Solomon Islands/3/2006 HA protein was mixed with NI04359_d30_245 and NI01056_d30_604 Fab at 1:4 molar ratio (Supplementary Table 11 ) and incubated overnight at 4 °C before purifying by size-exclusion chromatography on the Superose 6 Increased 10/300 column (Cytiva) in 20 mM Tris-HCl pH 8.0 and 100 mM NaCl.
The anchor Fab FISW84 54 was also added into the complex of NI01056_d30_604 Fab and H1N1 A/Solomon Islands/3/2006 HA to reduce the preferred orientation of the complex.
The complex peak was concentrated to around 3 mg ml −1 and mixed with 0.5% (w/v) n -octyl-β- d -glucoside (Anagrade) to a final concentration of 0.1% (w/v) just before loading onto the grid.
Cryo-EM grids were prepared using a Vitrobot Mark IV machine.
An aliquot of 3 μl sample was applied to a 300-mesh Quantifoil R1.2/1.3 Cu grid pretreated with glow-discharge.
High-resolution cryo-EM videos were collected on an FEI Titan Krios at 300 kV with a Gatan K3 detector.
Cryo-EM data processing and model building
All datasets of d30_103 and d30_240 were processed using cryoSPARC (v.4.5) 55 .
Dose-weighted video frame alignment was carried out using Patch motion correction in cryoSPARC live to account for stage drift and beam-induced motion.
The contrast transfer function (CTF) was estimated using Patch CTF in cryoSPARC live.
Micrographs were curated based on CTF fits; those worse than 7–8 Å were excluded due to poor quality.
Individual particles were selected from an initial subset of several hundred micrographs using Blob picker.
After several rounds of 2D classification, classes resembling the Fab–HA complex were used to pick templates for all micrographs.
Clean particle stacks were selected through iterative rounds of 2D classification and subsequently used for ab initio reconstruction, followed by heterogeneous refinement to further remove junk particles.
The resulting reference volume was used as an initial model for homogeneous and/or non-uniform refinement with C 3 symmetry applied.
Particles were subjected to 3D classification, and the best classes were further refined using non-uniform refinement with subsequent global CTF refinement, yielding the final map.
For model building, the AlphaFold3-predicted model and the cryo-EM structure of Mich15 H1 (PDB: 7KNA ) were used as the initial models for HK14 H3 and Mich15 H1, respectively.
The antibody Fv models were generated using ABodyBuilder2 56 .
The models were fitted into the cryo-EM maps using UCSF ChimeraX 57 .
The models were manually adjusted using Coot (v.0.9.8) 58 and further refined through Rosetta Relax 59 and real-space refinement in Phenix 60 .
HAs were numbered according to the H3 numbering scheme, while the antibody Fv was numbered based on the Kabat numbering scheme.
Buried surface area, epitope and paratope residues, and their interactions were analysed using the PISA server 61 and Epitope Analyzer 62 .
Buried surface area was calculated using a cut-off of >5 Å 2 , and hydrogen bonds were defined as atomic interactions with a distance of ≤3.5 Å.
Structural figures were generated using UCSF ChimeraX 57 .
Datasets of NI04359_d30_245 and NI01056_d30_604 were processed with CryoSPARC 55 (v.4.5).
Videos were subjected to motion correction and CTF estimation, and particles were picked with CryoSPARC blob picker followed by 2D classification 63 .
The best classes from blob picker were used as templates for CryoSPARC template pickers, and the resulting particles were cleaned up by multiple rounds of 2D classification before ab initio reconstruction.
The best class from ab initio reconstruction was subjected to homogenous refinement, reference-based motion correction, another round of homogenous refinement, local and global CTF estimation, and non-uniform refinement.
Antibody NI04359_d30_245 and NI01056_d30_604 complexes were processed with C 1 symmetry.
All maps were sharpened using DeepEMhancer 64 and all of the initial atomic models were built using ModelAngelo 65 .
The models were subjected to multiple rounds of manual refinement in Coot 66 (v.0.9.8) and real-space refinement in Phenix 60 .
This process was iterated for several cycles until no significant improvement in the model was observed.
Validation statistics are listed in Supplementary Table 11 .
HA sequence conservation analysis
Full-length human H3N2 and H1N1 HA protein sequences circulating from 1968 to 2024 and 1977 to 2024, respectively, were downloaded from the GISAID database.
To minimize temporal sampling bias, up to ten sequences per year were selected.
Multiple-sequence alignments were conducted using Clustal Omega, and the resulting alignments were used to generate sequence logos with WebLogo 3.
The sequence logos were further manually refined and annotated in Adobe Illustrator.
All human H1 (1918–1957; 1977–2024) and H3 (1968–2024) protein sequences with complete HA2 regions were downloaded from NCBI and GISAID (as of 22 September 2024).
Using a Python script, the natural occurrence frequencies of amino acid at position 46 of HA2 in each year were calculated for H1 and H3 separately.
The results were plotted as bar graphs with the ggplot2 package in R (v.4.2).
Cryo-EM structures of d30_103 and d30_240 in complex with Mich15 H1 were used as the starting models for molecular dynamics (MD) simulations.
Moreover, complexes of d30_103 and d30_240 with NC99 H1 were modelled based on the previously reported NC99 H1 structure (PDB 8TP5 ) and the Mich15 H1 complexes.
The starting structures for MD simulations were prepared in the Molecular Operating Environment (Chemical Computing Group) using the Protonate3D tool 67 .
These structures were then further processed using CHARMM-GUI 68 .
Each model was placed into a cubic water box of TIP3P water molecules with a minimum wall distance of 12 Å from the protein, and the system was neutralized with K + and Cl − ions to a final concentration of 0.15 mM 69 .
For all simulations, parameters of the AMBER force field 19SB were used 70 .
For the glycans, we used the GLYCAM force field, namely the GLYCAM-06j parameter set 71 .
We then performed three repetitions of 1 µs of classical molecular dynamics simulations for each HA–antibody complex using Amber24 72 .
MD simulations were performed in an NpT ensemble using pmemd.cuda 73 .
Bonds involving hydrogen atoms were restrained by applying the SHAKE algorithm, allowing a time step of 2 fs (ref.
74 ).
The Langevin thermostat was used to maintain the temperature during simulations at 300 K with a collision frequency of 2 ps −1 , and a Monte Carlo barostat with one volume change attempt per 100 steps was applied 75 , 76 , 77 .
The interaction energies were calculated with cpptraj using the interaction energy (LIE) tool 78 .
The electrostatic interaction energies were calculated for all frames of each simulation and provided the simulation-averages of these interactions.
To calculate the interactions and interaction frequencies of the binding interface, we used the GetContacts tool (Stanford University, https://getcontacts.github.io/ ).
ChimeraX was used for visualization 57 .
All statistical analyses were performed using R v.4.2.2 or GraphPad Prism 10.
Details of the statistics used in each experiment were indicated in the corresponding figure legends.
P < 0.05 was considered to be significant, and P > 0.05 was considered to be not significant.
The number of repeats for experiments and the specific tests for statistical significance used are indicated in the figure legends.
Results without specifying the number of repeats were collected in one experiment.
General data analysis and visualization were performed using Adobe Illustrator and Microsoft Word, PowerPoint and Excel.
Further information on research design is available in the Nature Portfolio Reporting Summary linked to this article.
The cryo-EM maps and atomic coordinates have been deposited to the Electron Microscopy Data Bank (EMDB) and the Protein Data Bank (PDB) under accession numbers: EMD-70233 and 9O8Q for NI06063_d30_103 Fab and EMD-70235 and 9O8S for NI04359_d30_240 Fab in a complex with HA of A/Hongkong/4801/2014; EMD-70234 and 9O8R for NI06063_d30_103 Fab and EMD-70236 and 9O8T for NI04359_d30_240 Fab in complex with HA of A/Michigan/45/2015; EMD-70502 and 9OI2 for NI04359_d30_245 Fab and EMD-70503 and 9OI3 for NI01056_d30_604 Fab in complex with HA of A/Solomon Islands/3/2006.
PDB entries 4JTV , 6XGC , 7KNA and 8TP5 were downloaded from PDB and used in this study.
All 10x scRNA-seq data generated in this study (5′ transcriptome, BCR immunoglobulin V(D)J gene repertoire and cell surface feature barcode) are available in the Gene Expression Omnibus database (GEO) under the GEO Series record GSE297740 .
All HA protein sequences used in this study were downloaded from NCBI and GISAID databases.
Source data are provided with this paper.
Gostic, K.
M., Ambrose, M., Worobey, M.
& Lloyd-Smith, J.
O.
Potent protection against H5N1 and H7N9 influenza via childhood hemagglutinin imprinting.
Science 354 , 722–726 (2016).
Article ADS CAS PubMed PubMed Central Google Scholar
Francis, T.
Jr.
On the doctrine of original antigenic sin.
Proc.
Am.
Phil.
Soc.
104 , 572–578 (1960).
Iuliano, A.
D.
et al.
Estimates of global seasonal influenza-associated respiratory mortality: a modelling study.
Lancet 391 , 1285–1300 (2018).
Skehel, J.
J.
& Wiley, D.
C.
Receptor binding and membrane fusion in virus entry: the influenza hemagglutinin.
Annu.
Rev.
Biochem.
69 , 531–569 (2000).
Article CAS PubMed Google Scholar
Koel, B.
F.
et al.
Substitutions near the receptor binding site determine major antigenic change during influenza virus evolution.
Science 342 , 976–979 (2013).
Article ADS CAS PubMed Google Scholar
Smith, D.
J.
et al.
Mapping the antigenic and genetic evolution of influenza virus.
Science 305 , 371–376 (2004).
Guthmiller, J.
J.
et al.
Broadly neutralizing antibodies target a haemagglutinin anchor epitope.
Nature 602 , 314–320 (2022).
Wu, N.
C.
& Wilson, I.
A.
Influenza hemagglutinin structures and antibody recognition.
Cold Spring Harb.
Perspect.
Med.
10 , a038778 (2020).
Article CAS PubMed PubMed Central Google Scholar
Corti, D.
et al.
Heterosubtypic neutralizing antibodies are produced by individuals immunized with a seasonal influenza vaccine.
J.
Clin.
Invest.
120 , 1663–1673 (2010).
Liang, C.-Y.
et al.
Imprinting of serum neutralizing antibodies by Wuhan-1 mRNA vaccines.
Nature 630 , 950–960 (2024).
Cyster, J.
G.
& Wilson, P.
C.
Antibody modulation of B cell responses-Incorporating positive and negative feedback.
Immunity 57 , 1466–1481 (2024).
Schaefer-Babajew, D.
et al.
Antibody feedback regulates immune memory after SARS-CoV-2 mRNA vaccination.
Nature 613 , 735–742 (2023).
Victora, G.
D.
& Nussenzweig, M.
C.
Germinal centers.
Annu.
Rev.
Immunol.
40 , 413–442 (2022).
Liu, Y.
J.
et al.
Memory B cells from human tonsils colonize mucosal epithelium and directly present antigen to T cells by rapid up-regulation of B7-1 and B7-2.
Immunity 2 , 239–248 (1995).
Good, K.
L., Avery, D.
T.
& Tangye, S.
G.
Resting human memory B cells are intrinsically programmed for enhanced survival and responsiveness to diverse stimuli compared to naive B cells.
J.
Immunol.
182 , 890–901 (2009).
Turner, J.
S.
et al.
Human germinal centres engage memory and naive B cells after influenza vaccination.
Nature 586 , 127–132 (2020).
Dugan, H.
L.
et al.
Preexisting immunity shapes distinct antibody landscapes after influenza virus infection and vaccination in humans.
Sci.
Transl.
Med.
12 , eabd3601 (2020).
Kim, J.
H., Skountzou, I., Compans, R.
& Jacob, J.
Original antigenic sin responses to influenza viruses.
J.
Immunol.
183 , 3294–3301 (2009).
Linderman, S.
L.
& Hensley, S.
E.
Antibodies with ‘original antigenic sin’ properties are valuable components of secondary immune responses to influenza viruses.
PLoS Pathog.
12 , e1005806 (2016).
Article PubMed PubMed Central Google Scholar
Schiepers, A.
et al.
Molecular fate-mapping of serum antibody responses to repeat immunization.
Nature 615 , 482–489 (2023).
Schmidt, A.
G.
et al.
Immunogenic stimulus for germline precursors of antibodies that engage the influenza hemagglutinin receptor-binding site.
Cell Rep.
13 , 2842–2850 (2015).
Yu, X.
et al.
Neutralizing antibodies derived from the B cells of 1918 influenza pandemic survivors.
Nature 455 , 532–536 (2008).
Fonville, J.
M.
et al.
Antibody landscapes after influenza virus infection or vaccination.
Science 346 , 996–1000 (2014).
Andrews, S.
F.
et al.
Immune history profoundly affects broadly protective B cell responses to influenza.
Sci.
Transl.
Med.
7 , 316ra192 (2015).
Vieira, M.
C.
et al.
Lineage-specific protection and immune imprinting shape the age distributions of influenza B cases.
Nat.
Commun.
12 , 4313 (2021).
Gostic, K.
M.
et al.
Childhood immune imprinting to influenza A shapes birth year-specific risk during seasonal H1N1 and H3N2 epidemics.
PLoS Pathog.
15 , e1008109 (2019).
Edler, P.
et al.
Immune imprinting in early life shapes cross-reactivity to influenza B virus haemagglutinin.
Nat.
Microbiol.
9 , 2073–2083 (2024).
Guthmiller, J.
J.
& Wilson, P.
C.
Remembering seasonal coronaviruses.
Science 370 , 1272–1273 (2020).
Dugan, H.
L.
et al.
Profiling B cell immunodominance after SARS-CoV-2 infection reveals antibody evolution to non-neutralizing viral targets.
Immunity 54 , 1290–1303 (2021).
Setliff, I.
et al.
High-throughput mapping of B cell receptor sequences to antigen specificity.
Cell 179 , 1636–1646 (2019).
Meade, P.
et al.
Influenza virus infection induces a narrow antibody response in children but a broad recall response in adults.
mBio 11 , e03243-19 (2020).
Kuraoka, M.
et al.
Infant antibody repertoires during the first two years of influenza vaccination.
mBio 13 , e0254622 (2022).
Joyce, M.
G.
et al.
Vaccine-induced antibodies that neutralize group 1 and group 2 influenza A viruses.
Cell 166 , 609–623 (2016).
Guthmiller, J.
J., Utset, H.
A.
& Wilson, P.
C.
B cell responses against influenza viruses: short-lived humoral immunity against a life-long threat.
Viruses 13 , 965 (2021).
McCarthy, K.
R.
et al.
A prevalent focused human antibody response to the influenza virus hemagglutinin head interface.
mBio 12 , e0114421 (2021).
Zost, S.
J.
et al.
Canonical features of human antibodies recognizing the influenza hemagglutinin trimer interface.
J.
Clin.
Invest.
131 , e146791 (2021).
Andrews, S.
F.
et al.
Preferential induction of cross-group influenza A hemagglutinin stem-specific memory B cells after H7N9 immunization in humans.
Sci.
Immunol.
2 , eaan2676 (2017).
Ray, R.
et al.
Eliciting a single amino acid change by vaccination generates antibody protection against group 1 and group 2 influenza A viruses.
Immunity 57 , 1141–1159 (2024).
Laursen, N.
S.
et al.
Universal protection against influenza infection by a multidomain antibody to influenza hemagglutinin.
Science 362 , 598–602 (2018).
Gaiotto, T.
& Hufton, S.
E.
Cross-neutralising nanobodies bind to a conserved pocket in the hemagglutinin stem region identified using yeast display and deep mutational scanning.
PLoS ONE 11 , e0164296 (2016).
Zompi, S., Montoya, M., Pohl, M.
O., Balmaseda, A.
& Harris, E.
Dominant cross-reactive B cell response during secondary acute dengue virus infection in humans.
PLoS Negl.
Trop.
Dis.
6 , e1568 (2012).
Takada, K.
et al.
A humanized MDCK cell line for the efficient isolation and propagation of human influenza viruses.
Nat.
Microbiol.
4 , 1268–1273 (2019).
Martín, J.
et al.
Studies of the binding properties of influenza hemagglutinin receptor-site mutants.
Virology 241 , 101–111 (1998).
Hai, R.
et al.
Influenza viruses expressing chimeric hemagglutinins: globular head and stalk domains derived from different subtypes.
J.
Virol.
86 , 5774–5781 (2012).
Heaton, H.
et al.
Souporcell: robust clustering of single-cell RNA-seq data by genotype without reference genotypes.
Nat.
Methods 17 , 615–620 (2020).
Guthmiller, J.
J., Dugan, H.
L., Neu, K.
E., Lan, L.
Y.
& Wilson, P.
C.
An efficient method to generate monoclonal antibodies from human B cells.
Methods Mol.
Biol.
1904 , 109–145 (2019).
Liu, S.
T.
H.
et al.
Antigenic sites in influenza H1 hemagglutinin display species-specific immunodominance.
J.
Clin.
Invest.
128 , 4992–4996 (2018).
Neumann, G., Fujii, K., Kino, Y.
& Kawaoka, Y.
An improved reverse genetics system for influenza A virus generation and its implications for vaccine production.
Proc.
Natl Acad.
Sci.
USA 102 , 16825–16829 (2005).
Teo, Q.
W.
et al.
Stringent and complex sequence constraints of an IGHV1-69 broadly neutralizing antibody to influenza HA stem.
Cell Rep.
42 , 113410 (2023).
Zhang, J., Kobert, K., Flouri, T.
& Stamatakis, A.
PEAR: a fast and accurate Illumina Paired-End reAd mergeR.
Bioinformatics 30 , 614–620 (2014).
Cock, P.
J.
A.
et al.
Biopython: freely available Python tools for computational molecular biology and bioinformatics.
Bioinformatics 25 , 1422–1423 (2009).
Ouyang, W.
O.
et al.
Probing the biophysical constraints of SARS-CoV-2 spike N-terminal domain using deep mutational scanning.
Sci.
Adv.
8 , eadd7221 (2022).
Addetia, A.
et al.
Structural changes in the SARS-CoV-2 spike E406W mutant escaping a clinical monoclonal antibody cocktail.
Cell Rep.
42 , 112621 (2023).
Benton, D.
J.
et al.
Influenza hemagglutinin membrane anchor.
Proc.
Natl Acad.
Sci.
USA 115 , 10112–10117 (2018).
Punjani, A., Rubinstein, J.
L., Fleet, D.
J.
& Brubaker, M.
A.
cryoSPARC: algorithms for rapid unsupervised cryo-EM structure determination.
Nat.
Methods 14 , 290–296 (2017).
Abanades, B.
et al.
ImmuneBuilder: deep-Learning models for predicting the structures of immune proteins.
Commun.
Biol.
6 , 575 (2023).
Pettersen, E.
F.
et al.
UCSF ChimeraX: structure visualization for researchers, educators, and developers.
Protein Sci.
30 , 70–82 (2021).
Emsley, P.
& Cowtan, K.
Coot: model-building tools for molecular graphics.
Acta Crystallogr.
D 60 , 2126–2132 (2004).
Article ADS PubMed Google Scholar
Conway, P., Tyka, M.
D., Dimaio, F., Konerding, D.
E.
& Baker, D.
Relaxation of backbone bond geometry improves protein energy landscape modeling.
Protein Sci.
23 , 47–55 (2014).
Afonine, P.
V.
et al.
Real-space refinement in PHENIX for cryo-EM and crystallography.
Acta Crystallogr.
D 74 , 531–544 (2018).
Krissinel, E.
& Henrick, K.
Inference of macromolecular assemblies from crystalline state.
J.
Mol.
Biol.
372 , 774–797 (2007).
Montiel-Garcia, D., Rojas-Labra, O., Santoyo-Rivera, N.
& Reddy, V.
S.
Epitope-Analyzer: a structure-based webtool to analyze broadly neutralizing epitopes.
J.
Struct.
Biol.
214 , 107839 (2022).
Punjani, A.
& Fleet, D.
J.
3DFlex: determining structure and motion of flexible proteins from cryo-EM.
Nat.
Methods 20 , 860–870 (2023).
Sanchez-Garcia, R.
et al.
DeepEMhancer: a deep learning solution for cryo-EM volume post-processing.
Commun.
Biol.
4 , 874 (2021).
Jamali, K.
et al.
Automated model building and protein identification in cryo-EM maps.
Nature 628 , 450–457 (2024).
Casañal, A., Lohkamp, B.
& Emsley, P.
Current developments in Coot for macromolecular model building of electron cryo-microscopy and crystallographic data.
Protein Sci.
29 , 1055–1064 (2020).
Labute, P.
Protonate3D: assignment of ionization states and hydrogen coordinates to macromolecular structures.
Proteins Struct.
Funct.
Bioinform.
75 , 187–205 (2009).
Jo, S., Kim, T., Iyer, V.
G.
& Im, W.
CHARMM-GUI: a web-based graphical user interface for CHARMM.
J.
Comput.
Chem.
29 , 1859–1865 (2008).
Jorgensen, W.
L., Chandrasekhar, J., Madura, J.
D., Impey, R.
W.
& Klein, M.
L.
Comparison of simple potential functions for simulating liquid water.
J.
Chem.
Phys.
79 , 926–935 (1983).
Tian, C.
et al.
ff19SB: amino-acid-specific protein backbone parameters trained against quantum mechanics energy surfaces in solution.
J.
Chem.
Theory Comput.
16 , 528–552 (2020).
Kirschner, K.
N.
et al.
GLYCAM06: a generalizable biomolecular force field.
Carbohydrates.
J.
Comput.
Chem.
29 , 622–655 (2008).
Case, D.
A.
et al.
AmberTools.
J.
Chem.
Inf.
Model.
63 , 6183–6191 (2023).
Lee, T.-S.
et al.
GPU-accelerated molecular dynamics and free energy methods in Amber18: performance enhancements and new features.
J.
Chem.
Inf.
Model.
58 , 2043–2050 (2018).
Miyamoto, S.
& Kollman, P.
A.
Settle: an analytical version of the SHAKE and RATTLE algorithm for rigid water models.
J.
Comput.
Chem.
13 , 952–962 (1992).
Adelman, S.
A.
& Doll, J.
D.
Generalized Langevin equation approach for atom/solid-surface scattering: general formulation for classical scattering off harmonic solids.
J.
Chem.
Phys.
64 , 2375–2388 (1976).
Doll, J.
D., Myers, L.
E.
& Adelman, S.
A.
Generalized Langevin equation approach for atom/solid-surface scattering: Inelastic studies.
J.
Chem.
Phys.
63 , 4908–4914 (1975).
Åqvist, J., Wennerström, P., Nervall, M., Bjelic, S.
& Brandsdal, B.
O.
Molecular dynamics simulations of water and biomolecules with a Monte Carlo constant pressure algorithm.
Chem.
Phys.
Lett.
384 , 288–294 (2004).
Roe, D.
R.
& Cheatham, T.
E.
III PTRAJ and CPPTRAJ: software for processing and analysis of molecular dynamics trajectory data.
J.
Chem.
Theory Comput.
9 , 3084–3095 (2013).
We thank all of the participants from Nicaragua who enrolled in the Household Influenza Transmission Study (HITS) and the Nicaraguan Pediatric Influenza Cohort Study (NPICS); the teams and personnel at Nicaragua, St Jude Children’s Research Hospital, University of Michigan and Nationwide Children’s Hospital who participated in sample processing and shipment; T.
Miller for helping with cell sorting; and Y.
Niu and L.
Ye from Rockefeller University for discussions.
Figure 1a and Extended Data Fig.
9a were created using BioRender.
This study was funded by DIVINCI U01 grant U01AI144616; NIAID U01 AI187063-01; NIAID 1U01AI165452-04; NIAID 1U19AI168632-03; NIAID Centers of Excellence for Influenza Research and Surveillance (CEIRS): HHSN272201400005C (P.C.W.); NIAID Centers of Excellence for Influenza Research and Response (CEIRR): 75N93019R00028 (P.C.W.); NIAID Centers of Collaborative Influenza Vaccine Innovation Centers (CIVICs): 75N93019C00051 (P.C.W., F.K.
and A.B.W.); and AI168632 (O.R., A.M.
and P.C.W.).
These authors contributed equally: Jiayi Sun, Gyunghee Jo
Drukier Institute for Children’s Health, Department of Pediatrics, Weill Cornell Medicine, New York, NY, USA
Jiayi Sun, Chloe A.
Troxell, Yanbin Fu, Joshua J.
C.
McGrath, Siriruk Changrob, Sean A.
Nelson, Atsuhiro Yasuhara, Min Huang, Nai-Ying Zheng, Jordan C.
Chervin, Lei Li & Patrick C.
Wilson
Department of Integrative Structural and Computational Biology, The Scripps Research Institute, La Jolla, CA, USA
Gyunghee Jo, Monica L.
Fernández-Quintero, Johannes R.
Loeffler, Alesandra J.
Rodriguez, Jiachen Huang, Olivia M.
Swanson, Andrew B.
Ward & Julianna Han
Department of Microbiology, Icahn School of Medicine at Mount Sinai, New York, NY, USA
Center for Vaccine Research and Pandemic Preparedness (C-VaRPP), Icahn School of Medicine at Mount Sinai, New York, NY, USA
Department of Biochemistry, University of Illinois Urbana-Champaign, Urbana, IL, USA
Huibin Lv, Qi Wen Teo, Tossapol Pholcharee & Nicholas C.
Wu
Carl R.
Woese Institute for Genomic Biology, University of Illinois Urbana-Champaign, Urbana, IL, USA
Huibin Lv, Qi Wen Teo & Nicholas C.
Wu
Influenza Research Institute, Department of Pathobiological Sciences, University of Wisconsin-Madison, Madison, WI, USA
Hassanein H.
Abozeid, Gabriele Neumann & Yoshihiro Kawaoka
Department of Poultry Diseases, Faculty of Veterinary Medicine, Cairo University, Giza, Egypt
Sustainable Sciences Institute, Managua, Nicaragua
Angel Balmaseda & Guillermina Kuan
Laboratorio Nacional de Virología, Centro Nacional de Diagnóstico y Referencia, Ministerio de Salud, Managua, Nicaragua
Centro de Salud Sócrates Flores Vivas, Ministerio de Salud, Managua, Nicaragua
Department of Epidemiology, School of Public Health, University of Michigan, Ann Arbor, MI, USA
Department of Host-Microbe Interactions, St Jude Children’s Research Hospital, Memphis, TN, USA
E.
Kaitlynn Allen & Paul G.
Thomas
Division of Virology, Department of Microbiology and Immunology, Institute of Medical Science, University of Tokyo, Tokyo, Japan
Pandemic Preparedness, Infection and Advanced Research Center (UTOPIA), University of Tokyo, Tokyo, Japan
Department of Pathology, Molecular and Cell-Based Medicine, Icahn School of Medicine at Mount Sinai, New York, NY, USA
Ignaz Semmelweis Institute, Interuniversity Institute for Infection Research, Medical University of Vienna, Vienna, Austria
Center for Vaccines and Immunity, Abigail Wexner Research Institute at Nationwide Children’s Hospital, Columbus, OH, USA
Asuncion Mejias & Octavio Ramilo
Department of Infectious Diseases, St Jude Children’s Research Hospital, Memphis, TN, USA
Search author on: PubMed Google Scholar
J.S., G.J., J.
Han, A.B.W.
and P.C.W.
conceptualized the study.
A.B., G.K., L.C., E.K.A., A.M.
and O.R.
participated in sample processing and management.
J.S., G.J., C.A.T., Y.F., R.H., H.L., S.A.N., L.L., J.
Han and G.N.
developed methodology.
J.S., G.J., C.A.T., Y.F., R.H., H.L., H.H.A., Q.W.T., T.P., J.J.C.M., S.C., A.Y., M.H., N.-Y.Z., J.C.C., L.L., M.L.F.-Q., J.R.L., A.J.R., J.
Huang and O.M.S.
conducted investigation.
J.S., G.J., C.A.T., H.L., L.L.
and O.M.S.
performed visualization.
N.C.W., Y.K., F.K., A.B.W., A.M., O.R., P.G.T., A.G.
and P.C.W.
acquired funding.
J.
Han, A.B.W.
and P.C.W.
supervised the study.
J.S., G.J.
and P.C.W.
wrote the original draft of the manuscript.
All of the authors reviewed and edited the manuscript.
Correspondence to Patrick C.
Wilson .
Nature thanks Deepta Bhattacharya and the other, anonymous, reviewer(s) for their contribution to the peer review of this work.
Peer reviewer reports are available.
Publisher’s note Springer Nature remains neutral with regard to jurisdictional claims in published maps and institutional affiliations.
Extended data figures and tables
Extended Data Fig.
1 Representative flow cytometry gating for sorting CD19+ and HA-specific B cells.
a , b , Representative flow cytometry plots showing gating strategy for sorting HA-specific ( a ) and CD19+ ( b ) B cells.
c , d , Flow cytometry ( c ) and bar ( d ) plots showing percentages of HA-specific B cells in each group.
Extended Data Fig.
2 Correlation analysis on probe scores of HA-specific B cells and ELISA AUC of corresponding mAbs.
Simple linear regression are performed to calculate Pearson correlation coefficient (R) for each HA probe.
Predicted value on best-fit lines and 95% confidence bands are shown.
Extended Data Fig.
3 Transcriptional data and BCR profile of HA-specific B cells.
a , Seurat UMAP of HA-specific B cells from each group with percentages of cells in each B cell subset shown in pie charts.
b , Expression of genes of interest for cells from each group in a .
c , Representative genes upregulated in indicated subsets of HA-specific B cells in children compared to adults.
d , Top 10 differentially expressed genes in each subset of HA-specific B cells.
e - g , Isotype ( e ), heavy chain SHMs ( f ), and antigen reactivity ( g ) of HA-specific B cells from each group in a .
Box and whisker plot in f shows first quartiles (lower bound of box), means (line in the middle), and third quartiles (upper bound of box), with whiskers extending to minimum/maximum values (within 1.5 times of Interquartile Range).
Sample sizes for each subset in f (from left to right) of Adults H1: n = 106, 146, 97, 49, 64, and 6 cells; Children H1 only: n = 408, 252, 84, 119, 76, and 34 cells; Children H3-H1: n = 306, 296, 125, 110, 101, and 16 cells; Children H1-H3: n = 281, 196, 66, 66, 111, and 2 cells.
h , GSEA analysis showing relevant biological processes enriched in genes upregulated in recent GC emigrants.
Sample sizes for biological processes (from top to bottom) are 13, 7, 5, 10, 7, 9, 16, and 22 genes.
Adaptive multi-level split Monte-Carlo scheme.
Two-sided unpaired Mann-Whitney test.
Adjusted P values are shown for multiple comparisons.
Extended Data Fig.
4 Transcriptional data of total CD19 + B cells.
a , Seurat UMAP of CD19 + B cells from all subjects and time points combined.
TBC, transitional B cell; NBC, naïve B cell; MBC, memory B cell; atBC, atypical B cell; ASC, antibody-secreting cell.
b , Percentages of CD19 + B cells from each B cell subset between adults and children.
Box and whisker plot shows first quartiles (lower bound of box), means (line in the middle), and third quartiles (upper bound of box), with whiskers extending to minimum/maximum values (within 1.5 times of Interquartile Range).
Adults: n = 12; Children: n = 31.
Two-sided unpaired Mann-Whitney test.
c , Expression of genes of interest for cells in a .
d , Top 10 differentially expressed genes in each subset of CD19 + B cells.
Extended Data Fig.
5 Fine epitope mapping of H1 head mAbs and structural analysis of two neutralizing H1 stalk mAbs using non-stereotypical IgV genes from H1 adults and H3-H1 children.
Extended Data Fig.
6 Microneutralization IC 50 of neutralizing H1/H3 cross-reactive mAbs in each group against indicated heterosubtypic avian viruses.
Neutralization potency (IC 50 ) of H1/H3 CR mAbs from each group against seven group 1 and three group 2 avian influenza viruses are measured by microneutralization assay.
Imprinting subtype determined by germline specificity and exposure history is shown for each mAb.
Results represent an average of two technical replicates from one of the two independent experiments.
Extended Data Fig.
7 Cryo-EM data processing of NI06063_d30_103 and NI04359_d30_240 Fabs in complex with HK14 H3 and Mich15 H1.
a , b , Representative micrographs ( a ) and 2D class averages ( b ) of NI06063_d30_103 and NI04359_d30_240 Fabs in complex with HK14 H3 and Mich15 H1.
The scale bar represents 100 nm ( a ) or 130 Å ( b ).
c , Local resolution maps.
d , Gold-standard Fourier shell correlation curves and viewing direction distributions.
The 0.143 cutoff is indicated by a horizontal black line.
Extended Data Fig.
8 Identification of key residues responsible for the binding loss of H1/H3 CR mAbs in H3-H1 children to pre-pdm H1 HAs.
a , Amino acid sequence alignment of selected HA2 residues in d30_103 epitope from multiple H1 and H3 HAs, with residue 46 highlighted in yellow (Asp, D) or blue (Asn, N).
b , Molecular structures of residue D versus N.
c , K d of 15 neutralizing cross-group mAbs (IgGs) from H3-H1 children against Mich15 H1 WT and Mich15 H1 D46N mutant HAs.
d , Summary data of c with increase or decrease in apparent affinity indicated by colour.
All values higher than 10000 nM are categorized as negative and replaced by 20000 nM.
Mean is shown as a straight line.
Results in c and d represent an average of two technical replicates from one of the two independent experiments for n = 15 mAbs.
Two-sided wilcoxon matched-pairs signed rank test.
e , ELISA AUC of germline reverted mAbs in c against indicated HAs.
f , ELISA AUC of seven mAbs in c that do not bind H1 HAs of pre-pdm strains at all against indicated HAs.
Extended Data Fig.
9 BCR profile of HA-specific B cells in infants following the first influenza vaccination and IgV gene repertoires of affinity-matured HA-specific B cells from all groups.
a , Collection of convalescent blood from infants primed by inactivated influenza vaccine (IIV).
Created in BioRender; Wilson, P.
https://BioRender.com/zlp8ask (2026).
b , Predicted antigen specificity (probe scores) of affinity-matured HA-specific B cells in convalescent infants following the first influenza vaccination.
c , Percentages of H1/H3 CR mAbs that do or do not bind NC99 H1 HA.
d , e , Isotype ( d ) and heavy chain SHMs ( e ) of cells in b .
Sample size is 142 cells.
Box and whisker plot in e shows first quartiles (lower bound of box), means (line in the middle), and third quartiles (upper bound of box), with whiskers extending to minimum/maximum values (within 1.5 times of Interquartile Range).
f - i , VH and VK/L pairing of H1 head ( f ), H1 stalk ( g ), H3 ( h ), and H1/H3 CR ( i ) B cells coloured by group identity.
Extended Data Table 1 Demographics and exposure information of adults, children, and infants in this study Full size table
Supplementary Tables (download PDF )
Reporting Summary (download PDF )
Peer Review file (download PDF )
Source Data Fig.
1 (download XLSX )
Source Data Fig.
2 (download XLSX )
Source Data Fig.
3 (download XLSX )
Source Data Fig.
4 (download XLSX )
Source Data Fig.
5 (download XLSX )
Source Data Extended Data Fig.
2 (download XLSX )
Source Data Extended Data Fig.
3 (download XLSX )
Source Data Extended Data Fig.
4 (download XLSX )
Source Data Extended Data Fig.
6 (download XLSX )
Source Data Extended Data Fig.
8 (download XLSX )
Source Data Extended Data Fig.
9 (download XLSX )
Version of record : 11 March 2026
DOI : https://doi.org/10.1038/s41586-026-10248-6
Related Stories


Source: This article was originally published by Nature News
Read Full Original Article →
Comments (1)
Hello http://truemediax.com,
I checked your website. You have an impressive site but ranking is not good on Google, Yahoo and Bing.
Would you like to optimize your site?
If you’re interested, then I will send you SEO Packages and strategies.
Can I send?
Warm regards,
Nancy
Leave a Comment