Nature ( 2026 ) Cite this article
Plant nucleotide-binding leucine-rich repeat (NLR) immune receptors detect pathogen effectors and activate immunity 1 .
Coiled-coil NLRs (CNLs) form resistosomes as Ca 2+ -permeable channels in the plasma membrane (PM) 2 , 3 , 4 .
However, the mechanism by which resistosomes activate cell death remains unclear.
Here we report that the CNL SUPPRESSOR OF mkk1 mkk2 2 (SUMM2), unlike canonical CNLs that use a MADA motif to penetrate the PM 5 , tethers to the PM through N-myristoylation, a common feature among many CNLs.
PM targeting via N-myristoylation is essential for SUMM2-induced cell death.
Upon activation, SUMM2 promotes the association of the lipase-like proteins ENHANCED DISEASE SUSCEPTIBILITY 1 (EDS1) and PHYTOALEXIN DEFICIENT 4 (PAD4) with the helper NLR-ACTIVATED DISEASE RESISTANCE 1-LIKE 1 (ADR1-L1).
Furthermore, active SUMM2 induces the clustering of multiple ADR1-L1 resistosomes into a ring-like assembly colocalized with the EDS1–PAD4 complex, and the EDS1–PAD4–ADR1 module is essential for SUMM2-activated cell death.
Together, these findings reveal that N-myristoylation-mediated PM targeting of SUMM2 promotes the assembly of higher-order EDS1–PAD4–ADR1-L1 resistosome clusters for cell death initiation.
Pathogen effector recognition-dependent association of NRG1 with EDS1 and SAG101 in TNL receptor immunity
The EDS1–PAD4–ADR1 node mediates Arabidopsis pattern-triggered immunity
TRIM28 SUMOylates and stabilizes NLRP3 to facilitate inflammasome activation
To defend against infection, plants deploy cell-surface-resident pattern recognition receptors (PRRs) recognizing microbe-associated molecular patterns and intracellular NLRs sensing pathogen effectors 1 , 6 .
The variable N terminus of plant NLRs, either a coiled-coil, Toll/interleukin-1 receptor/resistance protein (TIR) or RESISTANCE TO POWDERY MILDEW 8 (RPW8)-like CC (CC R ) domain, subdivides NLRs into CNLs, TNLs and RNLs, respectively 7 , 8 , 9 .
CNLs often require NON-RACE-SPECIFIC DISEASE RESISTANCE 1 (NDR1), a glycosylphosphatidylinositol-anchored protein, to activate downstream signalling 10 .
By contrast, TNLs typically rely on lipase-like proteins EDS1, PAD4 and SENESCENCE-ASSOCIATED GENE 101 (SAG101), which form EDS1–PAD4 or EDS1–SAG101 heterodimers to mediate signalling 7 , 8 , 9 .
RNLs, divided into the N REQUIREMENT GENE 1 (NRG1) family and ADR1 family, are helper NLRs required for immunity activated primarily by TNLs and some CNLs, and basal immunity 11 , 12 .
Like animal NLRs, plant NLRs oligomerize to resistosomes upon activation 1 , 6 , 13 .
N-myristoylation is common in CNLs
Approximately 20% of plant CNLs, including Arabidopsis HOPZ-ACTIVATED RESISTANCE 1 (ZAR1) and Solanaceae helper NLR-REQUIRED FOR CELL DEATHs (NRCs), carry an N-terminal MADA motif crucial for PM targeting and immune activation 5 , 21 (Extended Data Fig.
1a ).
Upon effector-triggered oligomerization, the MADA motif of ZAR1 CC (coiled-coil domain of ZAR1) forms the amphipathic α1 helix that penetrates the PM, whereas, in its inactive state, the α1 helix is buried in a four-helix bundle 4 , 22 (Fig.
1a ).
NRC4 CC with a MADA motif folds similarly as ZAR1 CC (ref.
23 ) (Fig.
1a ).
By contrast, SUMM2 CC lacks the MADA motif (Fig.
1b ) and forms a residual α1 helix with a flexible fold, protruding away from the three-helix bundle, resembling the active ZAR1 CC (Fig.
1a ).
The Positioning of Proteins in Membranes algorithm 24 , which models protein 3D structures in a membrane bilayer, predicts that although the α1 helix of the active ZAR1 resistosome protrudes into membranes (Extended Data Fig.
1b ), the SUMM2 residue α1 helix and flexible fold only anchor to the membrane bilayer without penetration (Extended Data Fig.
1c ).
This anchoring is also observed for the CNL RPS5 CC , which also lacks a MADA motif (Extended Data Fig.
1c ).
Fig.
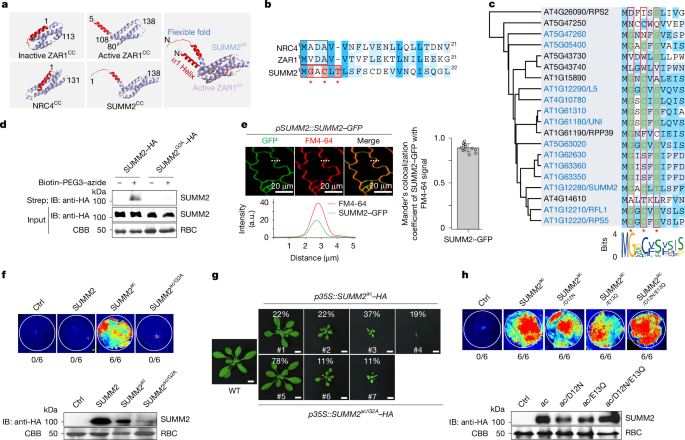
1: N-myristoylation motif is common in non-MADA CNLs.
a , Predicted structures of NRC4 CC and SUMM2 CC , and cryo-EM structures of inactive and active ZAR1 CC .
The right panel shows the SUMM2 CC structure superposed with active ZAR1 CC .
b , Sequence alignment of NRC4 1 – 21 , ZAR1 1–21 and SUMM2 1 – 22 with the MADA motif boxed in black and MGxCxT indicated by the red asterisks.
c , N-myristoylation motif in type II CNLs.
Conserved residues are boxed in red.
d , SUMM2 is myristoylated in planta.
SUMM2–HA or SUMM2 G2A –HA was expressed in N.
benthamiana leaves, followed by click reaction and immunoblotting (IB; top).
Input proteins are shown with IB (middle) and Coomassie brilliant blue (CBB) staining of Rubisco (RBC; bottom).
Molecular weight markers are indicated in kDa.
e , SUMM2–GFP localizes to the PM.
Cotyledons of pSUMM2::SUMM2 – GFP/ WT transgenic plants were imaged by a confocal microscope following FM4-64 staining (top left).
Overlap of SUMM2–GFP fluorescence and the FM4-64 signal along the white dotted line is also shown (bottom left).
Quantification of colocalization using Mander’s overlap coefficient, displayed as mean ± s.d.
with each dot representing an individual cell ( n = 12; right).
f , N-myristoylation motif is essential for SUMM2 ac -induced cell death.
Cell death was documented under UV light 2 days after Agrobacterium infiltration in N.
benthamiana leaves, with the ratio of cell death leaves to total inoculated leaves indicated.
Protein expression is also shown (bottom).
g , N-myristoylation motif is required for SUMM2 ac -triggered cell death in Arabidopsis .
Transgenic plants representing different levels of dwarfism with the corresponding percentage are shown.
Scale bars, 1 cm.
h , Negatively charged residues in N-terminal SUMM2 are not required for cell death induction in N.
benthamiana .
The ratio of cell death leaves to total inoculated leaves is indicated.
In immunoblots ( d , f , h ), RBCs were run on the same gels as loading controls.
Experiments ( d – h ) were repeated three times with similar results.
For gel source data, see Supplementary Fig.
1 .
Source data Full size image
a , Predicted structures of NRC4 CC and SUMM2 CC , and cryo-EM structures of inactive and active ZAR1 CC .
The right panel shows the SUMM2 CC structure superposed with active ZAR1 CC .
b , Sequence alignment of NRC4 1 – 21 , ZAR1 1–21 and SUMM2 1 – 22 with the MADA motif boxed in black and MGxCxT indicated by the red asterisks.
c , N-myristoylation motif in type II CNLs.
Conserved residues are boxed in red.
d , SUMM2 is myristoylated in planta.
SUMM2–HA or SUMM2 G2A –HA was expressed in N.
benthamiana leaves, followed by click reaction and immunoblotting (IB; top).
Input proteins are shown with IB (middle) and Coomassie brilliant blue (CBB) staining of Rubisco (RBC; bottom).
Molecular weight markers are indicated in kDa.
e , SUMM2–GFP localizes to the PM.
Cotyledons of pSUMM2::SUMM2 – GFP/ WT transgenic plants were imaged by a confocal microscope following FM4-64 staining (top left).
Overlap of SUMM2–GFP fluorescence and the FM4-64 signal along the white dotted line is also shown (bottom left).
Quantification of colocalization using Mander’s overlap coefficient, displayed as mean ± s.d.
with each dot representing an individual cell ( n = 12; right).
f , N-myristoylation motif is essential for SUMM2 ac -induced cell death.
Cell death was documented under UV light 2 days after Agrobacterium infiltration in N.
benthamiana leaves, with the ratio of cell death leaves to total inoculated leaves indicated.
Protein expression is also shown (bottom).
g , N-myristoylation motif is required for SUMM2 ac -triggered cell death in Arabidopsis .
Transgenic plants representing different levels of dwarfism with the corresponding percentage are shown.
Scale bars, 1 cm.
h , Negatively charged residues in N-terminal SUMM2 are not required for cell death induction in N.
benthamiana .
The ratio of cell death leaves to total inoculated leaves is indicated.
In immunoblots ( d , f , h ), RBCs were run on the same gels as loading controls.
Experiments ( d – h ) were repeated three times with similar results.
For gel source data, see Supplementary Fig.
1 .
Phylogenetic analysis of coiled-coil domains of Arabidopsis 41 CNLs and 5 RNLs divided them into three subgroups: all MADA-CNLs, such as ZAR1, are in group I; SUMM2, RPS5 and RPS2 are in group II, also called CC G10 -NLRs; and helper NLRs (CC R -NLRs) are in group III 12 , 25 , 26 (Extended Data Fig.
1d ).
Of note, a consensus N-myristoylation motif (M-G-x-x-x-S/T), in which the glycine mediates covalent attachment of myristic acid to the target proteins 27 , is present in 65% of group II CNLs, including SUMM2 and RPS5 (Fig.
1c and Extended Data Fig.
1a ).
In addition, 45% of group II CNLs contain a palmitoylation cysteine (C) site adjacent to the N-myristoylation site (M-G-x-C-x-S/T) 28 (Fig.
1c ).
In line with the role of N-myristoylation and palmitoylation mediating protein PM anchoring, most group II MGxxxS/T CNLs were predicted to anchor to membranes via their α1 helix (Extended Data Figs.
1c and 2 ).
N-myristoylation in SUMM2 cell death
Using click chemistry 29 , we confirmed that SUMM2, but not SUMM2 G2A carrying a mutation at the second G to alanine (A), was myristoylated when expressed in Nicotiana benthamiana (Fig.
1d ).
Similarly, SUMM2 CC –GFP, but not SUMM2 CC/G2A –GFP, expressed in N.
benthamiana was recognized by an α-myristoylation antibody (Extended Data Fig.
3a ).
SUMM2 myristoylation was not altered upon activation by silencing MEKK1 in pSUMM2::SUMM2–FLAG transgenic plants (Extended Data Fig.
3b ).
Moreover, myristoylation levels were comparable between wild-type (WT) SUMM2 and the active SUMM2 ac , which bears an aspartate-to-valine substitution at the 478th residue (D478V), when expressed in N.
benthamiana (Extended Data Fig.
3c ).
SUMM2 tagged with GFP under its native promoter ( pSUMM2::SUMM2–GFP ), expressed in Arabidopsis WT Col-0 plants or transiently expressed in N.
benthamiana , localized to the periphery of epidermal cells and colocalized with FM4-64, a lipophilic dye labelling the PM, under confocal microscopy (Fig.
1e and Extended Data Fig.
3d ).
By contrast, SUMM2 G2A –GFP showed substantially reduced PM association with increased cytoplasm localization (Extended Data Fig.
3d ).
Specifically, SUMM2 G2A –GFP displayed a more diffuse, punctate pattern with reduced overlap with FM4-64 (Extended Data Fig.
3d,e ).
In addition, the protein abundance of SUMM2 G2A –HA was reduced compared with SUMM2–HA, probably due to the proteasome-mediated degradation (Extended Data Fig.
3f,g ).
The data point to a role of N-myristoylation-mediated PM localization in regulating SUMM2 protein stability.
SUMM2 ac triggers cell death in N.
benthamiana .
However, the SUMM2 ac G2A mutant (SUMM2 ac/G2A ) no longer induced cell death (Fig.
1f ).
Moreover, transgenic plants carrying p35S::SUMM2 ac/G2A –HA displayed reduced growth defects compared with p35S::SUMM2 ac –HA in WT Arabidopsis (Fig.
1g ).
The data highlight the importance of N-myristoylation for the function of SUMM2.
Besides the MADA motif, two conserved leucine (L) residues (L10 and L14 in ZAR1 CC , L15 and L19 in wheat CNL Sr35 and L9 in NRC4) are essential for the PM protruding and function 3 , 22 , 30 .
SUMM2 CC lacks the first leucine (Extended Data Fig.
4a ), and substitution of the second leucine (SUMM2 ac/L22A ) still triggered cell death (Extended Data Fig.
4b ).
Furthermore, plant CNLs and helper NLRs possess Ca 2+ -permeable channel activities with several negatively charged residues essential for channel activities and cell death elicitation 2 , 3 , 4 (Extended Data Fig.
4a ).
Mutations of two cognate residues, D12 and E13, in SUMM2 ac , did not alter its cell death induction in N.
benthamiana (Fig.
1h and Extended Data Fig.
4c ).
Yet, expression of SUMM2 ac triggered intracellular Ca 2+ increases in planta, as measured by Ca 2+ biosensor GCaMP3 in transgenic N.
benthamiana (Extended Data Fig.
4d ).
In addition, Ca 2+ influx channel blockers LaCl 3 and GdCl 3 suppressed the cell death triggered by SUMM2 ac , suggesting the involvement of Ca 2+ channels and signalling in SUMM2-mediated cell death (Extended Data Fig.
4e ).
Together, the data support that SUMM2, and probably other N-myristoylated CNLs, deploy different features from the MADA motif CNLs, such as ZAR1 and NRC4, in PM anchoring and cell death induction.
EDS1–PAD4–ADR1s downstream of CNL SUMM2
Two distinct signalling modules, EDS1–PAD4–ADR1s and EDS1–SAG101–NRG1s, regulate sensor NLRs, especially TNL-mediated disease resistance and cell death 1 , 11 , 13 .
We investigated their involvement in SUMM2-mediated autoimmunity, which can be triggered upon silencing of MEKK1 (ref.
20 ).
The adr1 triple/ nrg1 double mutant ( adr1/L1/L2/nrg1.1/1.2 ) and the eds1-2 mutant substantially suppressed RNAi -MEKK1- induced plant dwarfism and growth defects (Fig.
2a ).
In addition, the adr1/L1/L2 and pad4-1 mutants, but not the nrg1.1/1.2 nor the sag101 mutant, suppressed RNAi -MEKK1- induced growth defects (Fig.
2a ).
Transforming p35S::gADR1–HA or p35S::ADR1-L2–HA into adr1/L1/L2 restored cell death upon MEKK1 silencing (Extended Data Fig.
5a ).
Similarly, expressing p35S :: EDS1–HA recovered RNAi- MEKK1 cell death in eds1-2 (Extended Data Fig.
5b ).
Moreover, RNAi- MEKK1- induced cell death, H 2 O 2 accumulation and elevated expression of PATHOGENESIS-RELATED 1 ( PR1 ) and PR2 genes were alleviated in adr1/L1/L2 , eds1-2 and pad4-1 mutants compared with WT plants (Fig.
2b,c and Extended Data Fig.
5c ).
Fig.
2: The EDS1–PAD4–ADR1s module functions downstream of SUMM2.
a – c , RNAi- MEKK1- induced plant dwarfism ( a ), cell death and H 2 O 2 accumulation ( b ) and PR1 and PR2 expression ( c ) are suppressed in adr1/L1/L2 , eds1-2 and pad4-1 .
Plants are shown 2 weeks after virus-induced gene silencing ( a ).
Scale bars, 1 cm ( a ) and 0.5 cm ( b ).
RT–qPCR data are shown as mean ± s.d.
( n = 3; c ).
Ctrl, control.
d , The mekk1 seedling lethality is alleviated in adr1/L1/L2/mekk1 and summ2/mekk1 .
Three-week-old seedlings on 1/2 MS medium are shown.
Scale bars, 0.5 cm.
e , SUMM2 ac -triggered plant dwarfism is alleviated in eds1-2 , pad4-1 and adr1/L1/L2 .
Two representative 3-week-old plants are shown.
Scale bars, 1 cm.
f , SUMM2 ac -triggered cell death and H 2 O 2 accumulation are alleviated in adr1/L1/L2 .
Scale bars, 1 cm (top).
Images were converted to greyscale, and the mean value of the area was scored by ImageJ, with data shown as mean ± s.e.m.
( n = 5; bottom).
g , Model depicting the genetic relationship of the EDS1–PAD4–ADR1s module and SUMM2 in mekk1–mkk1/2–mpk4 autoimmunity.
h , SUMM2 associates with EDS1 and PAD4, but not ADR1-L1.
Proteins were co-expressed in Arabidopsis protoplasts (−, vector control) for immunoprecipitation (IP) and IB (top two panels).
Proteins before IP are input controls (bottom two panels).
i , SUMM2 ac promotes PAD4–GFP/EDS1–FLAG and ADR1-L1–mCherry association in a FRET-FLIM analysis.
The indicated combinations of proteins were expressed in Arabidopsis protoplasts, and the GFP mean fluorescence lifetime values ( τ ) were analysed, shown as mean ± s.e.m.
( n = 15).
j , SUMM2 ac promotes ADR1-L1 oligomerization.
ADR1-L1–FLAG was co-expressed with SUMM2 ac –GFP or SUMM2–GFP in Arabidopsis protoplasts.
Proteins were analysed by BN-PAGE (top) or SDS–PAGE (middle and bottom).
Experiments were repeated three times with similar results.
One-way analysis of variance (ANOVA) followed by the Tukey test ( c , f , i ).
For gel source data, see Supplementary Fig.
1 .
Source data Full size image
a – c , RNAi- MEKK1- induced plant dwarfism ( a ), cell death and H 2 O 2 accumulation ( b ) and PR1 and PR2 expression ( c ) are suppressed in adr1/L1/L2 , eds1-2 and pad4-1 .
Plants are shown 2 weeks after virus-induced gene silencing ( a ).
Scale bars, 1 cm ( a ) and 0.5 cm ( b ).
RT–qPCR data are shown as mean ± s.d.
( n = 3; c ).
Ctrl, control.
d , The mekk1 seedling lethality is alleviated in adr1/L1/L2/mekk1 and summ2/mekk1 .
Three-week-old seedlings on 1/2 MS medium are shown.
Scale bars, 0.5 cm.
e , SUMM2 ac -triggered plant dwarfism is alleviated in eds1-2 , pad4-1 and adr1/L1/L2 .
Two representative 3-week-old plants are shown.
Scale bars, 1 cm.
f , SUMM2 ac -triggered cell death and H 2 O 2 accumulation are alleviated in adr1/L1/L2 .
Scale bars, 1 cm (top).
Images were converted to greyscale, and the mean value of the area was scored by ImageJ, with data shown as mean ± s.e.m.
( n = 5; bottom).
g , Model depicting the genetic relationship of the EDS1–PAD4–ADR1s module and SUMM2 in mekk1–mkk1/2–mpk4 autoimmunity.
h , SUMM2 associates with EDS1 and PAD4, but not ADR1-L1.
Proteins were co-expressed in Arabidopsis protoplasts (−, vector control) for immunoprecipitation (IP) and IB (top two panels).
Proteins before IP are input controls (bottom two panels).
i , SUMM2 ac promotes PAD4–GFP/EDS1–FLAG and ADR1-L1–mCherry association in a FRET-FLIM analysis.
The indicated combinations of proteins were expressed in Arabidopsis protoplasts, and the GFP mean fluorescence lifetime values ( τ ) were analysed, shown as mean ± s.e.m.
( n = 15).
j , SUMM2 ac promotes ADR1-L1 oligomerization.
ADR1-L1–FLAG was co-expressed with SUMM2 ac –GFP or SUMM2–GFP in Arabidopsis protoplasts.
Proteins were analysed by BN-PAGE (top) or SDS–PAGE (middle and bottom).
Experiments were repeated three times with similar results.
One-way analysis of variance (ANOVA) followed by the Tukey test ( c , f , i ).
For gel source data, see Supplementary Fig.
1 .
We further generated the adr1/L1/L2/mekk1 quadruple mutant and confirmed that the severe growth defects and elevated PR expression in mekk1 were partially alleviated in adr1/L1/L2/mekk1 (Fig.
2d and Extended Data Fig.
5d,e ).
In addition, the adr1/L1/L2/mpk4 quadruple mutant showed alleviated growth defects, seedling lethality and PR expression compared with mpk4 (Extended Data Fig.
5f–h ).
These results reveal that the EDS1–PAD4–ADR1s module, but not EDS1–SAG101–NRG1s, is involved in Arabidopsis mekk1–mkk1/2–mpk4 autoimmunity.
Overexpression of MEKK2 causes stunted growth, cell death, elevated H 2 O 2 accumulation and PR expression in WT plants 18 , 20 , which were substantially reduced in adr1/L1/L2 and eds1-2 mutants (Extended Data Fig.
6a–f ).
Similarly, SUMM2 ac -triggered growth defects, cell death, H 2 O 2 accumulation and elevated PR expression in WT plants were alleviated in eds1-2 , pad4-1 and adr1/L1/L2 (Fig.
2e,f and Extended Data Fig.
6g,h ).
However, overexpression of ADR1 triggered a similar level of growth defects and autoimmunity in WT and summ2-8 plants (Extended Data Fig.
6i ).
The data delineate that the EDS1–PAD4–ADR1s module acts genetically downstream of SUMM2 in regulating mekk1–mkk1/2–mpk4 autoimmunity (Fig.
2g ).
Consistently, SUMM2 ac triggered EDS1-dependent cell death and ion leakage in N.
benthamiana (Extended Data Fig.
5i ).
Moreover, expression of Arabidopsis EDS1 and PAD4, but not EDS1 and SAG101, complemented the N.
benthamiana epss mutant (lacking functional Nb EDS1, Nb PAD4, Nb SAG101a and Nb SAG101b) in SUMM2 ac -triggered cell death (Extended Data Fig.
5j , top).
By contrast, SUMM2 ac -triggered cell death was unaffected in the N.
benthamiana nrg1-1 mutant (Extended Data Fig.
5k ).
The Pseudomonas syringae effector HopAI1 inactivates MAPKs to suppress PRR-mediated immunity 31 , but activates SUMM2-dependent cell death 32 .
HopAI1-induced cell death was substantially reduced in summ2 and adr1/L1/L2 mutants compared with WT, suggesting the physiological importance of the SUMM2–ADR1s module in response to bacterial infections (Extended Data Fig.
6j ).
Next, we explored whether SUMM2 interacts with the EDS1–PAD4–ADR1s complex.
Co-immunoprecipitation (co-IP) assays indicated that SUMM2–HA associated with FLAG-tagged EDS1 and PAD4, but not ADR1-L1, in Arabidopsis protoplasts (Fig.
2h ).
Förster resonance energy transfer-fluorescence lifetime imaging (FRET-FLIM) measurements further revealed that SUMM2–GFP was in close proximity to EDS1–mCherry and PAD4–mCherry, but not to ADR1-L1–mCherry on the PM (Extended Data Fig.
7a,b ).
EDS1 and PAD4 form a dimer independently of ADR1s (Extended Data Fig.
7c ).
Consistent with the EDS1–PAD4–ADR1s module in SUMM2-activated cell death, PAD4, but not SAG101, associates with SUMM2 (Extended Data Fig.
7d ).
The TIR domain-derived signalling molecules promote the interaction between EDS1–PAD4 and ADR1s 33 , 34 .
Of note, SUMM2 ac , but not SUMM2, promoted EDS1–PAD4–ADR1-L1 complex formation in FRET-FLIM assays, as indicated by further reduced PAD4–GFP fluorescence lifetime in the presence of ADR1-L1–mCherry, EDS1–FLAG and SUMM2 ac –HA (Fig.
2i and Extended Data Fig.
7e ).
In line with this, the association of EDS1–PAD4 with ADR1-L1 was increased in the presence of SUMM2 ac –GFP, but not SUMM2–GFP, in N.
benthamiana co-IP assays (Extended Data Fig.
7f ).
In addition, MEKK2, whose overexpression induces SUMM2-dependent autoimmunity 14 , promoted the association of EDS1–PAD4 with ADR1-L1 (Extended Data Fig.
7g ).
Similarly, expression of HopAI1 stimulated EDS1–PAD4–ADR1-L1 complex formation in Arabidopsis protoplasts (Extended Data Fig.
7h ).
Thus, activation of SUMM2 promotes the assembly of the EDS1–PAD4–ADR1s complex.
Compared with SUMM2, SUMM2 ac showed a reduced association with PAD4 (Extended Data Fig.
7i ).
It is possible that upon SUMM2 activation, EDS1–PAD4 might be released from SUMM2 and complex with ADR1s for signal initiation.
Activation of TIR signalling induces ADR1-L1 self-association and oligomerization 34 .
SUMM2 ac induced ADR1-L1 oligomerization in blue native-polyacrylamide gel electrophoresis (BN-PAGE) assays in Arabidopsis protoplasts (Fig.
2j ).
SUMM2 ac , but not SUMM2, promoted ADR1-L1 shift to a large complex of about 1,048 kDa from those below 480 kDa (Fig.
2j ).
Of note, the EDS1–PAD4 complex was detected in the same high-molecular-weight range as ADR1-L1 in BN-PAGE, suggesting the formation of a multimeric EDS1–PAD4–ADR1-L1 complex upon SUMM2 ac activation (Extended Data Fig.
7j ).
Several TNLs were highly induced in mpk4 compared with Col-0 (Extended Data Fig.
8a ).
To assess whether TIR NADase activity and TIR-dependent nucleotide production facilitate EDS1–PAD4 dissociation from active SUMM2, we performed a co-IP assay in Arabidopsis protoplasts during treatment with nicotinamide (NAM), an inhibitor of TIR enzymatic activity and cyclic ADP-ribose accumulation 35 .
In the presence of NAM, the association between SUMM2 ac and EDS1 or PAD4 was enhanced (Extended Data Fig.
8b,c ), suggesting an impaired release of EDS1–PAD4 from SUMM2 ac .
The data support the hypothesis that TIR-generated nucleotides are important in liberating EDS1–PAD4 from active SUMM2, thereby enabling their subsequent interaction with ADR1s.
Similarly, NAM treatment suppressed SUMM2 ac -induced cell death, ion leakage and calcium influx (Extended Data Fig.
8d,e ).
These results demonstrate the potential involvement of TIR enzymatic activity and downstream nucleotide production in the SUMM2–EDS1–PAD4–ADR1s cell death pathway.
Assembly of ADR1-L1 resistosome clusters
Under a confocal microscope, co-expression of ADR1-L1 tagged with either N-terminal YFP (nYFP) or C-terminal YFP (cYFP) reconstituted bimolecular fluorescence complementation YFP signals in the PM in N.
benthamiana (Extended Data Fig.
9a ), consistent with a low level of non-activated ADR1 self-association 34 , 36 .
The expression of SUMM2 ac , but not SUMM2, resulted in the alteration of reconstituted ADR1-L1–YFP signals into discrete puncta rather than as a continuous PM distribution (Extended Data Fig.
9b and Supplementary Video 1 ).
These ADR1-L1 puncta appeared stationary and immobile (Extended Data Fig.
9c ).
Similarly, SUMM2 ac , but not SUMM2, stimulated the puncta formation of ADR1-L1 tagged with TagRFP, a monomeric RFP, in N.
benthamiana (Fig.
3a ).
ADR1-L1–TagRFP is functional as it restored RNAi- MEKK1 -induced cell death in adr1/L1/L2 (Extended Data Fig.
9d ).
Of note, SUMM2 ac -induced ADR1-L1–TagRFP puncta formation depends on EDS1 and PAD4, but not on NRG1 (Extended Data Fig.
9e,f ).
Furthermore, expression of Arabidopsis EDS1 and PAD4, but not EDS1 and SAG101, rescued the puncta formation in the N.
benthamiana epss mutant in response to SUMM2 ac (Extended Data Fig.
5j , bottom), further supporting the involvement of the EDS1–PAD4–ADR1s module, but not the EDS1–SAG101–NRG1 module, in SUMM2-triggered immune responses.
In addition, NAM treatment suppressed SUMM2 ac -induced ADR1-L1–TagRFP puncta formation (Extended Data Fig.
8f ), consistent with a potential role for TIR-generated small molecules in this process.
Fig.
3: Active SUMM2 immobilizes ADR1-L1 puncta, forming a ring-like pattern.
a , SUMM2 ac stimulates ADR1-L1–TagRFP discontinuous distribution on the PM under confocal microscopy.
ADR1-L1–TagRFP was co-expressed with DEX::SUMM2–HA or DEX::SUMM2 ac –HA in N.
benthamiana .
Maximum-intensity projection represents 16 images with a z -step of 1 µm.
b , ADR1-L1–GFP exhibits punctate signals on the PM in mekk1 under confocal microscopy.
c , SUMM2 ac stimulates ADR1-L1–TagRFP to form immobile spots with a ring-like pattern under TIRF microscope (×4 magnification; right).
d , SUMM2 ac restricts ADR1-L1–TagRFP mobility.
Single-particle trajectories (top).
Data of D values represent mean ± s.e.m.
with each dot representing a single cell (ADR1-L1–TagRFP n = 13 and ADR1-L1–TagRFP+SUMM2 ac n = 11; bottom left).
Data from MSD analysis represent mean ± s.e.m.
from pooled trajectories (bottom right).
e , SUMM2 ac promotes progressive assembly of ADR1-L1–TagRFP resistosome clusters.
Images of clusters (dashed lines) containing different numbers of oligomers with mean cluster area quantified using ImageJ ( n = 12; left).
Distribution of resistosome clusters containing different numbers of oligomers (4 h, n = 157; 6 h, n = 193; right).
f , Fusion of ADR1-L1–TagRFP molecules into resistosomes with timelapse TIRF images (white arrow).
g , Violin plots of relative fluorescence intensity of ADR1-L1–TagRFP particles.
The violin plot represents pooled data from 18–20 cells detected by TIRF microscopy without (−; n = 1,625) or with (4 h, n = 454; 6 h, n = 315) SUMM2 ac .
Plots display the median and interquartile range, with the violin shape representing the kernel density distribution of fluorescence intensities.
h , ADR1-L1–GFP resistosomes assemble into clusters in mekk1 under a TIRF microscope.
i , ADR1-L1–GFP clusters contain two to six oligomers in mekk1 .
n = 67 (right).
j , SUMM2 ac promotes spatial clustering of ADR1-L1–TagRFP.
Heatmaps show the spatial distribution of ADR1-L1–TagRFP particles.
Each white dot marks the centroid of a particle detected by TIRF microscopy.
The warmer colours indicate regions of higher particle density (colour scale on the right).
Experiments were repeated three times with similar results.
Two-tailed Student’s t -test ( d ) or two-sided Kruskal–Wallis test, followed by pairwise Mann–Whitney U -tests with Bonferroni correction for multiple comparisons ( g ) were performed.
Source data Full size image
a , SUMM2 ac stimulates ADR1-L1–TagRFP discontinuous distribution on the PM under confocal microscopy.
ADR1-L1–TagRFP was co-expressed with DEX::SUMM2–HA or DEX::SUMM2 ac –HA in N.
benthamiana .
Maximum-intensity projection represents 16 images with a z -step of 1 µm.
b , ADR1-L1–GFP exhibits punctate signals on the PM in mekk1 under confocal microscopy.
c , SUMM2 ac stimulates ADR1-L1–TagRFP to form immobile spots with a ring-like pattern under TIRF microscope (×4 magnification; right).
d , SUMM2 ac restricts ADR1-L1–TagRFP mobility.
Single-particle trajectories (top).
Data of D values represent mean ± s.e.m.
with each dot representing a single cell (ADR1-L1–TagRFP n = 13 and ADR1-L1–TagRFP+SUMM2 ac n = 11; bottom left).
Data from MSD analysis represent mean ± s.e.m.
from pooled trajectories (bottom right).
e , SUMM2 ac promotes progressive assembly of ADR1-L1–TagRFP resistosome clusters.
Images of clusters (dashed lines) containing different numbers of oligomers with mean cluster area quantified using ImageJ ( n = 12; left).
Distribution of resistosome clusters containing different numbers of oligomers (4 h, n = 157; 6 h, n = 193; right).
f , Fusion of ADR1-L1–TagRFP molecules into resistosomes with timelapse TIRF images (white arrow).
g , Violin plots of relative fluorescence intensity of ADR1-L1–TagRFP particles.
The violin plot represents pooled data from 18–20 cells detected by TIRF microscopy without (−; n = 1,625) or with (4 h, n = 454; 6 h, n = 315) SUMM2 ac .
Plots display the median and interquartile range, with the violin shape representing the kernel density distribution of fluorescence intensities.
h , ADR1-L1–GFP resistosomes assemble into clusters in mekk1 under a TIRF microscope.
i , ADR1-L1–GFP clusters contain two to six oligomers in mekk1 .
n = 67 (right).
j , SUMM2 ac promotes spatial clustering of ADR1-L1–TagRFP.
Heatmaps show the spatial distribution of ADR1-L1–TagRFP particles.
Each white dot marks the centroid of a particle detected by TIRF microscopy.
The warmer colours indicate regions of higher particle density (colour scale on the right).
Experiments were repeated three times with similar results.
Two-tailed Student’s t -test ( d ) or two-sided Kruskal–Wallis test, followed by pairwise Mann–Whitney U -tests with Bonferroni correction for multiple comparisons ( g ) were performed.
Single-cell timelapse confocal imaging of N.
benthamiana leaves co-expressing ADR1-L1–TagRFP and DEX::SUMM2 ac –HA ( SUMM2 ac under the dexamethasone inducible promoter) indicated that the number and size of ADR1-L1–TagRFP puncta gradually increased at about 2 h after DEX treatment and became abundant and pronounced at 4.5 h, before the occurrence of cell death (Extended Data Fig.
9g,h ).
In addition, BRASSINOSTEROID-INSENSITIVE1 (BRI1)–GFP still exhibited a uniform PM localization pattern when SUMM2 ac activated ADR1-L1–TagRFP puncta (Extended Data Fig.
9i ), indicating that ADR1-L1–TagRFP puncta were unlikely due to altered PM integrity caused by SUMM2 ac -triggered cell death.
Moreover, ADR1-L1–GFP expressed under its native promoter ( p ADR1-L1::gADR1-L1–GFP ) or ADR1-L1–TagRFP expressed under the 35S promoter was evenly distributed along the cell periphery in WT plants but became punctate and discontinuous in mekk1 (Fig.
3b and Extended Data Fig.
9j ), in which SUMM2 is activated.
Similarly, RNAi- MEKK1 induced ADR1-L1–GFP puncta in pADR1-L1::gADR1-L1–GFP transgenic Arabidopsis plants in an EDS1-dependent and PAD4-dependent manner (Extended Data Fig.
9k ).
Furthermore, expression of HopAI1 stimulated ADR1-L1–GFP puncta formation at the cell periphery (Extended Data Fig.
9l ).
Together, the data support that SUMM2 activation induces the formation of ADR1-L1 puncta in the PM.
To examine the spatial distribution, assembly and dynamics of ADR1-L1 puncta at the PM, we used single-molecule imaging by total internal reflection fluorescence (TIRF) microscopy coupled with Leica’s THUNDER computational clearing, which enables high-speed in vivo imaging while enhancing image clarity and improving the signal-to-noise ratio for events occurring at or near the cell surface 37 .
Without SUMM2 activation, ADR1-L1 is uniformly distributed in the PM as highly mobile and small foci (Fig.
3c and Supplementary Video 2 ), resembling individual molecules of PM-localized proteins, such as FLAGELLIN-SENSING 2 (FLS2) and FERONIA (FER) 38 , 39 .
Upon SUMM2 activation, ADR1-L1 mobility is markedly reduced, forming discrete and immobile puncta that assemble into higher-order clusters with characteristic spatial arrangement as demonstrated by single-particle trajectory analysis, kymographs, peak diffusion coefficient ( D ) values and mean square displacement (MSD) measurements (Fig.
3c,d and Supplementary Video 3a,b ).
By contrast, SUMM2–GFP remains localized at the PM and exhibits comparable lateral mobility and diffusion dynamics before and after activation by silencing MEKK1 , as shown by single-particle tracking, diffusion coefficient distributions and MSD analyses (Extended Data Fig.
10a–e and Supplementary Video 4a,b ).
Similarly, both SUMM2–GFP and SUMM2 ac –GFP show similar localization patterns and mobility, suggesting that SUMM2 activation does not markedly alter its subcellular localization or dynamic behaviour at the PM (Extended Data Fig.
10f–j and Supplementary Video 5a,b ).
Following SUMM2 ac activation, each ADR1-L1 punctum observed under confocal microscopy comprised a cluster of two to six immobile spots under the TIRF microscope (Fig.
3c,e , Extended Data Fig.
10k and Supplementary Video 6 ).
These spots were gradually arranged in a ring-like pattern with up to six spots in a cluster upon SUMM2 activation (Fig.
3e and Extended Data Fig.
10l ).
Timelapse analysis indicates that these immobile spots were derived from the fusion of individual ADR1-L1 molecules (Fig.
3f and Supplementary Video 7 ).
Analysis of relative fluorescence intensity of ADR1-L1–TagRFP particles under inactive and activated conditions revealed a significant increase in brightness following DEX-induced expression of SUMM2 ac , consistent with the formation of oligomeric resistosomes (Fig.
3g ).
Although this relative quantification allows for comparison of ADR1-L1–TagRFP clustering behaviour under different conditions, it does not provide a direct or absolute measurement of stoichiometry in molecular terms.
It is possible that individual ADR1-L1–TagRFP molecules at the steady state form homodimers to maintain inactivity, as has been recently demonstrated for NRCs 30 , 40 , 41 .
Nevertheless, the ring-like cluster of ADR1-L1–TagRFP is composed of multiple ADR1-L1 resistosomes.
Formation of ADR1-L1–GFP resistosome clusters, including two to six oligomers, was also observed in pADR1-L1::gADR1-L1–GFP transgenic plants in the mekk1 mutant background or upon MEKK1 silencing, in an EDS1-dependent and PAD4-dependent manner (Fig.
3h,i and Extended Data Fig.
9k ).
Three-dimensional projection with Z -stack depth colour code visualization indicated that the SUMM2 ac -activated ADR1-L1 puncta were embedded in the PM (Extended Data Fig.
10m ).
The distribution pattern analysis revealed that ADR1-L1 resistosome cluster formation in the PM followed a clumpered dispersion pattern, implying that it is an organized, but not random, process (Fig.
3j and Extended Data Fig.
10n ).
The data support that in the steady state, ADR1-L1 is mobile, moving laterally on the inner surface of the PM; upon SUMM2 activation, ADR1-L1 oligomerizes into resistosomes, which progressively cluster and organize into a ring-like assembly embedded into the PM (Fig.
3j and Supplementary Video 8 ).
Of note, the ADR1-L1–TagRFP fluorescence-labelled ring-like pattern overlays with the bright, circular disc structure observed under the brightfield image, suggesting PM reorganization and perturbation associated with ADR1-L1 resistosomes upon SUMM2 activation (Fig.
3c ).
Activated NRCs, including Nb NRC2 and Nb NRC4, and tomato ( Solanum lycopersicum ) Sl NRC3 accumulate as membrane-associated puncta upon recognition of pathogen effectors 42 , 43 , 44 .
To assess whether NRCs also form resistosome clusters, we expressed Sl NRC3–GFP with and without Rpi-blb2/Avrblb2 activation in nrc2/3/4 N.
benthamiana plants.
As previously reported 43 , Sl NRC3–GFP formed PM-associated puncta upon Rpi-blb2/Avrblb2 activation under the confocal microscope (Extended Data Fig.
10o ).
Using a TIRF microscope, Sl NRC3–GFP formed distinct clusters in the presence of Rpi-blb2/Avrblb2, compared with its diffusion localization in the absence of effector activation (Extended Data Fig.
10o ).
These data suggest that the formation of resistosome clusters may be a common feature of helper NLR activation.
As ADR1-L1 interacts with EDS1–PAD4, forming a multimeric EDS1–PAD4–ADR1-L1 complex upon SUMM2 activation (Fig.
2j and Extended Data Fig.
7j ), we next investigated the association of the EDS1–PAD4 complex with the ADR1-L1 resistosome rings.
Consistent with previous studies 45 , 46 , the EDS1–PAD4 complex was detected in both the nucleus and the cytoplasm in bimolecular fluorescence complementation assays using EDS1–nYFP and PAD4–cYFP under confocal microscope in N.
benthamiana (Extended Data Fig.
10p ).
Upon expression of SUMM2 ac –HA, EDS1–PAD4–YFP signals accumulated as immobile puncta along the cell periphery, largely colocalizing (more than 70%) with ADR1-L1–TagRFP puncta (Fig.
4a ).
Of note, the EDS1–PAD4–YFP puncta displayed a ring-like appearance when observed using confocal maximum projection (Fig.
4a ).
Under a TIRF microscope, EDS1–PAD4–YFP appeared highly dynamic and diffuse under non-induced conditions, consistent with cytoplasmic diffusion (Fig.
4b and Supplementary Video 9a ).
By contrast, SUMM2 ac activation triggered the formation of highly organized EDS1–PAD4–YFP assemblies that colocalized with multiple ADR1-L1–TagRFP resistosome clusters (Fig.
4b and Supplementary Video 9b ).
These observations suggest that SUMM2 activation induces the higher-order EDS1–PAD4–ADR1-L1 assemblies that transition into static, membrane-associated puncta organized in defined ring-like clusters (Fig.
4c ).
Fig.
4: Active SUMM2 leads to the formation of EDS1–PAD4–ADR1-L1 ring-like assembly on the PM.
a , Active SUMM2 leads to the colocalization of EDS1–PAD4 with ADR1-L1 puncta under a confocal microscope.
ADR1-L1–TagRFP was co-expressed with EDS1–nYFP and PAD4–cYFP with and without DEX::SUMM2 ac –HA in N.
benthamiana .
Maximum-intensity projection represents 18 images with a z -step of 1 µm.
Insets are ×7 magnification (left).
Quantification of colocalization by Mander’s overlap coefficient, shown as mean ± s.d., with each dot representing an individual cell ( n = 16; right).
b , Active SUMM2 leads to the formation of EDS1–PAD4–ADR1-L1 clusters under a TIRF microscope.
YFP signals from the reconstituted EDS1–nYFP and PAD4–cYFP interaction show highly abundant ring-like structures on the PM, with two to six spaced ADR1-L1–TagRFP signals (middle columns).
Insets denote the regions zoomed in (right).
c , A model of SUMM2-activated EDS1–PAD4 ring-like assemblies with multiple ADR1-L1 resistosomes from top and transverse views.
Source data Full size image
a , Active SUMM2 leads to the colocalization of EDS1–PAD4 with ADR1-L1 puncta under a confocal microscope.
ADR1-L1–TagRFP was co-expressed with EDS1–nYFP and PAD4–cYFP with and without DEX::SUMM2 ac –HA in N.
benthamiana .
Maximum-intensity projection represents 18 images with a z -step of 1 µm.
Insets are ×7 magnification (left).
Quantification of colocalization by Mander’s overlap coefficient, shown as mean ± s.d., with each dot representing an individual cell ( n = 16; right).
b , Active SUMM2 leads to the formation of EDS1–PAD4–ADR1-L1 clusters under a TIRF microscope.
YFP signals from the reconstituted EDS1–nYFP and PAD4–cYFP interaction show highly abundant ring-like structures on the PM, with two to six spaced ADR1-L1–TagRFP signals (middle columns).
Insets denote the regions zoomed in (right).
c , A model of SUMM2-activated EDS1–PAD4 ring-like assemblies with multiple ADR1-L1 resistosomes from top and transverse views.
Our findings reveal a fundamental difference in the activation mechanisms of plant CNLs.
Whereas MADA-containing CNLs directly assemble into homomeric resistosomes that penetrate the inner PM and function as Ca 2+ -permeable channels upon activation 2 , 3 , 4 , some non-MADA CNLs, such as SUMM2 and RPS5, instead tether to the PM via N-myristoylation, which is crucial for their ability to induce cell death 47 (Fig.
1 ).
In contrast to MADA CNLs, SUMM2 activation may not involve the formation of Ca 2+ channel pores per se, but rather promotes the assembly of higher-order resistosome clusters composed of the EDS1–PAD4 signalling module and helper ADR1s at the PM, thereby initiating cell death.
Two distinct branches of EDS1-mediated immune signalling can be selectively activated by TNL-catalysed small molecules 33 , 48 .
SUMM2-mediated autoimmunity depends on the EDS1–PAD4–ADR1s branch in both Arabidopsis and N.
benthamiana (Fig.
2a–g and Extended Data Figs.
5j,k , 7d and 9k ), consistent with an early observation 49 .
In addition, SUMM2 specifically associates with EDS1–PAD4, but not with EDS1–SAG101 (Extended Data Fig.
7d ).
This specificity probably reflects distinct structural features of the EDS1–PAD4 and EDS1–SAG101 complexes, particularly sequence divergence within the EP domain of PAD4 and SAG101 (refs.
33 , 48 , 50 ).
Furthermore, TIR enzymatic activity and downstream nucleotide production are probably involved in the SUMM2–EDS1–PAD4–ADR1s cell death pathway (Extended Data Fig.
8 ).
Although the TNL RPS6 has been implicated in mekk1 cell death, it only has a marginal contribution in the Ler-0 accession, but not in Col-0 or RLD 51 , 52 .
It is therefore possible that additional TNLs act downstream of SUMM2 to activate the EDS1–PAD4–ADR1s module in Col-0.
An important question for future studies is whether the resistosome clusters observed upon activation of the CNL SUMM2 also form during TNL-triggered EDS1–PAD4–ADR1s signalling, which has a central role in driving host transcriptional defence reprogramming 53 .
Our data suggest that in the steady state, SUMM2 sequesters EDS1–PAD4 from complexing with ADR1s; upon activation, the EDS1–PAD4 heterodimer is released from SUMM2 and interacts with ADR1s to initiate signalling (Fig.
2h,i and Extended Data Fig.
7 ).
Similarly, TNL activation promotes the EDS1–SAG101 heterodimer to interact with the helper NLR NRG1 and NRG1 oligomerization 54 .
It has also been reported that the EDS1–SAG101 heterodimer is released from the EDS1–SAG101–NRG1 heterotrimer before subsequent NRG1 oligomerization upon TNL activation 55 .
These findings underscore the dynamic interactions among sensor NLRs, lipid-like signalosomes and helper NLRs.
SUMM2 activation triggers ADR1-L1 oligomerization (Fig.
2j ) and the formation of discontinuous puncta at the cell periphery (Fig.
3a,b ).
Similar punctate structures have also been observed for activated NRG1.1, NRCs and the plant homologue of vertebrate necroptosis inducer mixed-lineage kinase domain-like (MLKL) upon activation 2 , 42 , 43 , 44 , 56 , 57 .
Under a TIRF microscopy, ADR1-L1 puncta correspond to clusters of approximately two to six immobile ADR1-L1 resistosomes, which are frequently organized into a ring-like pattern that is also visible in the brightfield images (Fig.
3c–i ).
The apparent diameter of individual ADR1-L1–TagRFP resistosomes observed in our TIRF images is approximately 300–450 nm (Fig.
3 ), comparable with the scale (hundreds of nanometers) of ZAR1 resistosome puncta in live cell imaging 4 , but substantially larger than the approximately 20–30 nm pentameric or hexameric CNL resistosomes resolved by cryo-EM 3 , 22 , 30 .
In living cells, NLR activation probably promotes the formation of larger supramolecular assemblies that recruit multiple host proteins, membranes and possible cytoskeletal elements, which may further increase their apparent size through hydration and multivalent interactions.
Within ADR1-L1 puncta, these assemblies probably include EDS1–PAD4 dimers and additional components that potentially contribute to organizing the ring-like structure and executing cell death.
CNL and helper NLR resistosomes form PM pores that promote Ca 2+ influx and cell death 2 , 3 , 4 .
However, the predicted pore size of plant CNL resistosomes is substantially smaller than that of the gasdermin pores involved in mammalian pyroptosis 9 .
In mammals, pyroptotic signalling proceeds through a two-step membrane-disruption cascade: caspase-mediated cleavage of gasdermin produces PM pores that permit Ca 2+ influx and the release of small cytokines 58 , followed by NINJ1-dependent terminal membrane rupture that enables the escape of high-molecular-weight danger signals and cytosolic enzymes, ultimately leading to membrane lysis 59 , 60 .
The PM-localized protein NINJ1 forms large ring-like polymers that drive terminal PM rupture during pyroptosis by excising and releasing membrane disks 59 , 60 .
We speculate that plants may use a parallel, stepwise logic for inducing cell death, in which individual resistosomes first form non-canonical Ca 2+ -permeable channels, whereas the EDS1–PAD4–ADR1-L1 resistosome clusters, observed as a ring-like assembly on the PM, subsequently induce localized membrane disruption and potentially facilitate the release of cellular contents, thereby promoting terminal cell death.
This proposed model will require direct experimental validation in future studies.
Plant materials and growth conditions
The Arabidopsis thaliana ecotype Col-0 was used as the WT in this study.
The mekk1 ( salk_052557 ), mpk4 , summ2 ( summ2-8 ) and mekk2 mutants have been reported previously 18 , 61 , and the T-DNA insertion mutant ( salk_022911C , sag101 ) was obtained from the Arabidopsis Biological Resource Center.
The adr1 triple ( adr1/L1/L2 ) 62 , nrg1 double ( nrg1.1/1.2 ) 63 , adr1 triple/ nrg1 double ( adr1/L1/L2/nrg1.1/1.2 ) 53 , mekk1/summ2 , mpk4/mekk2 ref.
32 , pad4-1 ref.
64 and eds1-2 ref.
46 were previously described.
The adr1/L1/L2/mekk1 or adr1/L1/L2/mpk4 mutants were obtained by crossing adr1/L1/L2 with mekk1 or mpk4 heterozygous mutants, respectively.
The genotypes of the mutants were confirmed by PCR using the primers listed in Supplementary Table 1 .
The N.
benthamiana eds1 ref.
65 , pad4 ref.
65 , epss ( eds1a/pad4/sag101a/sag101b ) 66 , nrg1-1 ref.
67 and nrc2/3/4 ref.
68 mutants were previously described.
The Arabidopsis and N.
benthamiana plants were grown in soil (Metro Mix 366 for Arabidopsis and LP5 for N.
benthamiana ) in a growth room at 23 °C, 50% relative humidity, 75–100 µE m −2 s −1 light with a photoperiod of 12-h light–12-h dark.
Seedlings were grown on plates containing half-strength Murashige and Skoog medium (1/2 MS) with 0.5% sucrose, 0.8% agar and 2.5 mM MES at pH 5.7 in a growth room with the same conditions as above.
The virus-induced gene silencing (VIGS) constructs of pTRV-RNA1 and pTRV-RNA2 of pYL156-GFP (vector control) and pYL156-MEKK1 and plant expression constructs of MEKK2 , HopAI1 , SUMM2 and SUMM2 ac have been previously reported 18 , 61 .
The cDNA coding regions of ADR1-L2 ( AT5G04720 ), EDS1 ( AT3G48090 ), SAG101 (AT5G14930) , PAD4 ( AT3G52430 ) and RBA1 ( AT1G47370 ) were amplified from Col-0 cDNA using the primers containing Bam HI at the 5′ end and Stu I at the 3′ end and ligated into a plant gene expression pHBT vector under the control of the CaMV 35S promoter with a HA, FLAG, GFP or mCherry tag at the C terminus.
The genomic DNA fragment of g ADR1-L1 ( AT4G33300 , 2,844 bp) was amplified from Col-0 genomic DNA and subcloned into the pHBT vector under the CaMV 35S promoter with a FLAG, GFP or mCherry tag at the C terminus using a one-step cloning kit (Vazyme Biotech).
SUMM2 G2A , SUMM2 ac , SUMM2 ac/G2A , SUMM2 ac/L22A , SUMM2 ac/D12N , SUMM2 ac/E13Q and SUMM2 ac/D12N/E13Q were generated by site-directed mutagenesis using Platinum Pfx DNA polymerase-mediated PCR.
To make binary vector constructs, g ADR1 ( AT1G33560 , 2,787 bp), g ADR1-L1 , ADR1-L2 , EDS1 , RBA1 or SUMM2 mutant variants were subcloned into the binary vectors pMDC32-p2x35S::HA, pMDC32-p2x35S::FLAG or pMDC32-p2x35S::GFP by Bam HI and Stu I digestions or pTA7002-HA and pTA7002-GFP by Xho I and Stu I digestions.
To generate the binary vector pCB302-pSUMM2::SUMM2-GFP, the promoter of SUMM2 (2,685 bp upstream of ATG) was subcloned into the binary vector pCB302::GFP by Xho I and Bam HI digestions, and SUMM2 was inserted into pCB302-pSUMM2::GFP by Bam HI and Stu I digestions.
The fragment of SUMM2 CC (1–480 bp) was subcloned into the binary vector pMDC32-p2x35S::GFP by Bam HI and Stu I digestions.
To generate pCAMBIA2300-p35S::gADR1-L1-nYFP (1–174 amino acids) and pCAMBIA2300-p35S::gADR1-L1-cYFP (175–239 amino acids) plasmids, g ADR1-L1 was amplified from pHBT-p35S::gADR1-L1-FLAG and subcloned into pCAMBIA2300-p35S::nYFP and pCAMBIA2300-p35S::cYFP using a one-step cloning kit by Bam HI and Sma I digestions.
To generate pCAMBIA2300-p35S::EDS1-nYFP and pCAMBIA2300-p35S::PAD4-cYFP plasmids, EDS1 or PAD4 was amplified from pHBT-p35S::EDS1-FLAG or pHBT-p35S::PAD4-FLAG and subcloned into pCAMBIA2300-p35S::nYFP and pCAMBIA2300-p35S::cYFP using a one-step cloning kit by Bam HI and Sma I digestions.
To generate pCAMBIA1300-p35S::gADR1-L1-TagRFP-HA, g ADR1-L1 was amplified from pHBT-p35S::gADR1-L1-FLAG and subcloned into pCAMBIA1300-p35S::TagRFP-HA 69 using a one-step cloning kit by Bam HI or Spe I digestion.
To construct the pCAMBIA1300 binary vector containing the native promoter-driven g ADR1-L1 with a GFP tag at the C terminus, the promoter (2,036 bp upstream of the start codon) and genomic sequence were amplified from Col-0 genomic DNA using primers containing Xba I at the 5′ end and Stu I at the 3′ end, and ligated into pCAMBIA1300-GFP to obtain the pCAMBIA1300-pADR1-L1::gADR1-L1-GFP construct.
HopAI1 was subcloned into the binary vector pMDC32-p2x35S::HA by Bam HI and Stu I digestions.
The SlNRC3 gene from tomato was synthesized into the pUC57 vector (GenScript).
To generate pMDC32-p2x35S::SlNRC3-GFP, SlNRC3 was amplified from pUC57-SlNRC3 and ligated into the pMDC32-p2x35S::GFP vector using a one-step cloning kit by Bam HI and Stu I digestions.
The construct of pBRI1::BRI1-GFP has been previously described 70 .
All the primer sequences have been listed in Supplementary Table 1 .
The sequences of all genes and mutations were verified by Sanger sequencing.
Agrobacterium -mediated VIGS assays
Agrobacterium tumefaciens strain GV3101 carrying pTRV-RNA1 or pTRV-RNA2 was first cultured in 2 ml LB liquid medium containing 50 µg ml −1 kanamycin and 25 µg ml −1 gentamicin in the 20-ml glass culture tubes overnight at 28 °C in a roller drum and then transferred to 200 ml fresh LB liquid medium containing 50 µg ml −1 kanamycin, 25 µg ml −1 gentamicin, 10 mM MES and 20 µM acetosyringone for overnight at 28 °C with 200 rpm shaking.
Cells were pelleted by 1,300 g centrifugation, resuspended in buffer containing 10 mM MgCl 2 , 10 mM MES and 200 μM acetosyringone, adjusted to optical density at 600 nm of 1.5, and incubated at 25 °C for at least 3 h.
Bacterial cultures containing pTRV-RNA1 and pTRV-RNA2 derivatives were mixed at a ratio of 1:1 and inoculated into the first pair of true leaves of 2-week-old soil-grown plants using a needleless syringe.
Generation of transgenic plants and growth phenotype analyses
The binary plasmids were transformed into A.
tumefaciens strain GV3101 and introduced into Arabidopsis using floral dipping.
Transgenic plants were selected by glufosinate-ammonium (Basta, 50 μg ml −1 ) for the pCB302 vector and hygromycin (50 μg ml −1 ) for the pMDC vector.
Transgenic lines were analysed by immunoblotting using an anti-HA or anti-GFP antibody for protein expression.
To determine the requirement of the myristoylation motif for the SUMM2 function, p35S::SUMM2 ac -HA or p35S::SUMM2 G2A/ac -HA was transformed into WT plants.
Independent primary (T 1 ) transgenic plants with resistance to hygromycin (50 μg ml −1 ) were screened by immunoblotting using an anti-HA antibody.
On the basis of the severity of growth defects, 46 plants carrying p35S::SUMM2 ac -HA in WT were grouped into four categories, with 19% (9 out of 46) of plants exhibiting severe dwarfism, 37% (17 out of 46) showing moderate dwarfism, 22% (10 out of 46) showing weak dwarfism and 22% (10 out of 46) showing no dwarfism.
A total of 54 T 1 transgenic plants carrying p35S::SUMM2 G2A/ac -HA in WT were obtained and grouped into three categories, with 11% (6 out of 54) of plants exhibiting moderate dwarfism, 11% (6 out of 54) showing weak dwarfism and 78% (42 out of 54) showing no dwarfism.
To determine the requirement of ADR1/L1/L2 and EDS1 for overexpression of MEKK2 -mediated cell death, p35S::MEKK2-HA was transformed into WT, the adr1/L1/L2 triple or eds1-2 mutant, and followed by screening for hygromycin resistance and immunoblotting using anti-HA antibody.
A total of 32 T 1 transgenic plants carrying p35S::MEKK2-HA in WT were obtained and further classified into three categories, with 34.4% (11 out of 32) of plants exhibiting severe dwarfism, 40.6% (13 out of 32) showing moderate dwarfism and 25% (8 out of 32) showing weak dwarfism.
A total of 34 independent T 1 transgenic plants expressing p35S::MEKK2-HA in the adr1/L1/L2 background were obtained, with 11.8% (4 out of 34) of plants showing moderate dwarfism, 50% (17 out of 34) showing weak dwarfism and 38.2% (13 out of 34) showing slightly smaller size than adr1/L1/L2 .
A total of 48 independent T 1 transgenic lines carrying p35S::MEKK2-HA in the eds1-2 mutant with slight dwarfism were obtained.
To examine whether EDS1, PAD4 or ADR1/L1/L2 is required for SUMM2-mediated autoimmunity, p35S::SUMM2 ac -HA was transformed into WT, eds1 , pad4 or adr1/l1/l2 mutant followed by screening for hygromycin resistance and immunoblotting using an anti-HA antibody.
About 50% (23 out of 46) of p35S::SUMM2 ac -HA transgenic plants in WT showed severe dwarfism.
Transgenic plants carrying p35S::SUMM2 ac -HA in eds1-2 or pad4-1 showed weak dwarfism with 46.6% (21 out of 45) or 42.9% (18 out of 42), respectively.
Among 42 independent transgenic plants expressing p35S::SUMM2 ac -HA in adr1/L1/L2 , 33.3% (14 out of 42) of plants showed weak dwarfism.
Transgenic plants carrying p35S::gADR1-HA in WT or summ2 exhibited similar dwarfism, with 14.3% (5 out of 35) and 17.9% (7 out of 39), respectively.
To determine the requirement of ADR1/L1/L2 and SUMM2 in HopAI1 -mediated cell death, p35S::HopAI1-HA was transformed into WT, adr1/L1/L2 or summ2-8 and followed by screening for hygromycin resistance and immunoblotting using anti-HA antibody.
A total of 55 T 1 transgenic plants carrying p35S::HopAI1-HA in WT were obtained and further classified into three categories, with 56.4% (31 out of 55) of plants exhibiting severe dwarfism, 38.2% (21 out of 55) showing moderate dwarfism and 5.4% (3 out of 55) showing weak dwarfism.
A total of 26 independent T 1 transgenic plants expressing p35S::HopAI1-HA in the adr1/L1/L2 background were obtained, with 15.4% (4 out of 26) of plants exhibiting severe dwarfism, 30.8% (8 out of 26) showing weak dwarfism and 53.8% (14 out of 26) showing slightly smaller size than adr1/L1/L2 .
A total of 36 independent T 1 transgenic plants expressing p35S::HopAI1-HA in the summ2-8 background were obtained, with 13.9% (5 out of 36) of plants showing moderate dwarfism and 86.1% (31 out of 36) showing slightly smaller size than summ2-8 .
To obtain ADR1-L1 transgenic plants in WT and mekk1 for protein subcellular localization assay, pADR1-L1::gADR1-L1-GFP or p35S::gADR1-L1-TagRFP was transformed into mekk1 (+/−) heterozygous mutant plants, followed by screening in 1/2 MS medium containing hygromycin (50 μg ml −1 ) under dark conditions for 7 days.
Plants with elongated hypocotyls were transferred to 1/2 MS medium for another 10 days, and plants with severe dwarfism were subjected to imaging analysis followed by PCR analysis to genotype the mekk1 (−/−) homozygous background.
To obtain ADR1-L1 transgenic plants in WT and adr1/L1/L2 , p35S::gADR1-L1-TagRFP-HA was transformed into WT and adr1/L1/L2 -mutant plants, followed by screening in 1/2 MS medium containing hygromycin (50 μg ml −1 ) under dark conditions for 7 days.
Plants with elongated hypocotyls were transferred to soil for another 7 days and were subjected to VIGS assays.
The transgenic plants were confirmed with immunoblotting using anti-HA antibody.
To obtain ADR1-L1 transgenic plants in WT, eds1-2 and pad4-1 mutants, pADR1-L1::gADR1-L1-GFP was transformed into eds1-2 -mutant or pad4-1 -mutant plants, followed by screening in 1/2 MS medium containing hygromycin (50 μg ml −1 ) under dark conditions for 7 days.
Plants with elongated hypocotyls were transferred to soil for another 7 days and were subjected to VIGS assays.
The leaf samples were imaged with a confocal or TIRF microscope 2 weeks after infiltration.
The Arabidopsis protoplast isolation and transient assay followed a previously reported protocol 71 .
In brief, for co-IP assays, 100 μl of paired plasmid DNA (2 µg µl −1 ) was mixed with 1 ml of protoplasts (2 × 10 5 cells per ml) for the polyethylene glycol (PEG)-mediated transfection.
The transient assay in Arabidopsis plants has been previously reported 72 .
For transient assays in N.
benthamiana , the indicated constructs were transformed into A.
tumefaciens strain GV3010 by electroporation.
A single transformant was transferred into the 2 ml LB liquid medium containing 50 µg ml −1 kanamycin and 25 µg ml −1 gentamicin for overnight incubation at 28 °C.
Bacteria were harvested by centrifugation at 1,200 g and resuspended in the induction buffer (10 mM MgCl 2 , 10 mM MES pH 5.7 and 200 µM acetosyringone).
The Agrobacterium cultures were infiltrated into the leaves of 4-week-old N.
benthamiana .
Proteins were isolated 2–3 days after inoculation from the infiltrated area and subjected to immunoblotting analysis.
Cell death was observed at 2 days or the indicated time after 50 µM dexamethasone infiltration, and pictures were taken under the UV light with the ChemiDoc system.
The A.
tumefaciens strains carrying Rpi-blb2 or AVRblb2 have been previously described 73 .
Agrobacterium strains carrying the indicated genes were syringe-infiltrated into 3-week-old transgenic GCaMP3 N.
benthamiana leaves 74 .
At 48 h later, leaf discs (0.5 cm in diameter) were collected and placed in 200 µl ddH 2 O in 96-well cell culture plates and equilibrated for 1 h at 23 °C.
Followed by 50 μM DEX treatment, GCaMP3 fluorescence was recorded using VANTAstar Microplate reader (BMG LABTECH) with an excitation at 470 nm (15-nm bandwidth) and emission detection at 515 nm (20-nm bandwidth) with 20-µs integration time and 5-min cycle time.
Absolute fluorescence values for each experiment were normalized to the untreated control value as F/F eq (where F was the measured fluorescence at a given time point and F eq was the averaged measurement for water-equilibrated control samples with DEX treatment at the final resting time point measured).
Leaf discs (10 mm in diameter) were excised from N.
benthamiana plants infiltrated with Agrobacterium at the indicated times.
For protein expression under the DEX-inducible promoter, leaves were sprayed with 20 μM DEX before sampling.
Leaf discs were washed in 15 ml Milli-Q water for 50 min, then transferred to a 24-well plate with 1 ml Milli-Q water per well, and incubated at room temperature under light.
Ion leakage was measured using a conductometer LAQUAtwin EC-33 conductivity meter (Horiba).
Detection of N-myristoylation using click chemistry
The click chemistry-based approach to detect N-myristoylation was carried out based on the previously described protocol with modifications 29 .
In brief, N.
benthamiana leaves were infiltrated using a needleless syringe with Agrobacterium carrying the binary vector expressing SUMM2–HA or SUMM2(G2A)–HA.
At 12 h later, 10 μM cell-permeable ω-alkynyl fatty acid analogue Alk12 (alkynyl myristic acid; Cayman Chemical) was infiltrated for in vivo metabolic labelling of the myristoylated proteins, followed by a second round of infiltration at 30 h after Agrobacterium infiltration.
After 6 h, tissues were collected, and total proteins were extracted with RIPA buffer (1× PBS, pH 7.4, 1% Triton X-100, 0.5% sodium deoxycholate, 0.1% SDS and protease inhibitor cocktail from Roche), and treated with or without biotin–PEG3–azide for click reaction following the manufacturer’s protocol (VectorLabs).
Streptavidin affinity purification was used to enrich biotinylated proteins, and SUMM2 and SUMM2(G2A) were detected by immunoblotting using anti-HA antibody.
Trypan blue staining for cell death and DAB staining for H 2 O 2
Detached leaves were submerged in trypan blue staining solution (2.5 mg ml −1 trypan blue dissolved in lactophenol containing an equal volume of lactic acid, glycerol, liquid phenol and ddH 2 O) or 3,3′-diaminobenzidine (DAB) solution (1 mg ml −1 DAB dissolved in ddH 2 O, pH 3.8) for overnight incubation.
Samples were transferred into trypan blue destaining solution containing lactophenol and ethanol in a ratio of 1:2 or DAB destaining solution containing glycerol, acetic acid and ethanol in a ratio of 1:1:3 and incubated at 23 °C with gentle shaking until completely destained.
Samples were observed and recorded under a dissecting microscope.
Co-IP assays in Arabidopsis protoplasts and N.
benthamiana
Proteins were expressed overnight in Arabidopsis protoplasts or in N.
benthamiana leaves for 2 days.
Protoplasts were lysed, and leaves were ground in the extraction buffer (100 mM NaCl, 1 mM EDTA, 20 mM Tris-HCl, pH 7.5, 2 mM NaF, 2 mM Na 3 VO 4 , 1 mM dithiothreitol, 0.5% Triton X-100, 10% glycerol and protease inhibitor cocktail from Roche).
After centrifugation at 12,500 g at 4 °C for 15 min, 250 µl of extraction buffer was added to dissolve pellets, and 20 μl of supernatant was collected for input controls, and the remaining was incubated with anti-FLAG agarose (Sigma-Aldrich) or anti-HA agarose (Sigma-Aldrich) at 4 °C for 2 h with gentle shaking.
Beads were collected and washed three times with washing buffer (20 mM Tris-HCl, pH 7.5, 100 mM NaCl, 1 mM EDTA and 1% Triton X-100), and once with 50 mM Tris-HCl, pH 7.5.
Proteins were eluted by 2× SDS–PAGE loading buffer and boiled at 94 °C for 5 min.
Immunoprecipitated and input proteins were analysed by immunoblotting using the indicated antibodies.
Plant RNA isolation and RT–qPCR analyses
Total RNA was isolated from 2-week-old seedlings grown on 1/2 MS using TRIzol reagent (Invitrogen).
One microgram of total RNA was treated with RNase-free DNase I (NEB) and then was reverse transcribed to synthesize the first-strand cDNA with M-MuLV reverse transcriptase (NEB) and oligo (dT) 18 primer.
Quantitative PCR with reverse transcription (RT–qPCR) analysis was performed by iTaq Universal SYBR green Supermix (Bio-Rad) with a Bio-Rad CFX384 Real-Time PCR System (Bio-Rad) using primers listed in Supplementary Table 1 .
The expression of indicated genes was normalized to UBQ10 .
The data analysis was performed using one-way ANOVA followed by Tukey test for multiple comparisons.
Confocal fluorescent microscopic analyses
N.
benthamiana leaves were infiltrated with Agrobacterium carrying the suppressor of silencing HC-Pro and different combinations of fluorescent protein-tagged constructs, as shown in the figures.
In brief, g ADR1-L1–nYFP/gADR1-L1–cYFP or g ADR1-L1–TagRFP was co-expressed with DEX::SUMM2 ac –HA or DEX::SUMM2–HA for 2 days in N.
benthamiana , followed by 50 μM DEX treatment for the indicated time before imaging analysis using a laser scanning fluorescence confocal microscope-Leica TCS SP8 (Leica).
For Arabidopsis transgenic plants carrying g ADR1-L1–TagRFP driven by the 35S promoter or g ADR1-L1–GFP driven by the native promoter in the WT or mekk1 -mutant background, cotyledons of 2-week-old soil-grown transgenic lines were screened by Leica DMi8 with appropriate filters and light sources for detecting TagRFP and GFP fluorescence, and further imaged using a Leica Stellaris 5 confocal microscope.
For plasma membrane staining, leaves were infiltrated with FM4-64 staining solution (10 μM).
The excitation wavelength was 488 nm for GFP, 514 nm for YFP, 554 nm for TagRFP, 559 nm for FM4-64 and 587 nm for mCherry.
Emission was detected at 493–530 nm for GFP, 510–540 nm for YFP, 570–630 nm for TagRFP and 570–670 nm for FM4-64.
In all multicolour imaging, signals were acquired using line-sequential scanning.
The pinhole was set at 1 Airy unit.
Leica LAS X software was used to adjust brightness and contrast and generate maximum Z -projection and 3D images.
Fluorescence intensity profiles from selected regions of interest were generated using the Plot Profile plugin in Fiji.
The fluorescence intensity was normalized to the maximum intensity observed for each fluorophore and presented as arbitrary units (a.u.).
The number of ADR1-L1–TagRFP puncta was quantified in Fiji using the Analyze Particles function with parameters set to a size range of 0.08–1 μm 2 and circularity of 0.1–1.
TIRF microscopy was conducted using a Leica DMi8 Infinity system equipped with an HC PL APO ×100/1.47 numerical aperture oil immersion TIRF objective (Leica Microsystems).
The critical angle was adjusted to maximize the signal-to-noise ratio at the plasma membrane.
Images were processed using the THUNDER computational clearing algorithm in LAS X software (Leica Microsystems), with the adaptive strategy, refractive index 1.33 and water as the mounting medium.
This approach improves image contrast by suppressing out-of-focus blur while preserving the diffraction-limited lateral resolution (approximately 200–250 nm).
Kymographs were generated in Fiji using the Multiple Kymograph plugin from TIRF image sequences consisting of 80 frames acquired over 10 s (120 ms per frame; exposure time of 95 ms).
Laser 488 was used for GFP and YFP excitation, and laser 561 for TagRFP excitation.
Emission for GFP and YFP was detected using a filter cube GFP for TIRF; for TagRFP, it was detected using a filter cube mCherry for TIRF.
3D projections were created from z -stack images acquired with a z -step of 0.05 µm using the LAS X software and colour coded according to depth to highlight the vertical distribution of the structures.
Single-particle tracking and diffusion analysis
Single-particle tracking was performed on TIRF timelapse image sequences acquired at 8 frames per second with an exposure time of 95 ms.
Fluorescent particles were detected and tracked using the TrackMate plugin in Fiji 75 .
Spot detection used the Laplacian of Gaussian detector with an estimated particle diameter of 0.3 µm, and trajectories were reconstructed using the linear assignment problem tracker with a maximum frame-to-frame linking distance of 0.4 µm.
Only trajectories with a minimum of 10 consecutive frames were retained for further analysis.
MSD analysis and diffusion coefficient ( D ) estimation were performed using a custom Python pipeline.
Time-averaged MSDs were calculated for each trajectory, and D values were extracted by fitting the first five points of the MSD curve to a linear model, MSD( t ) = 4 Dt + offset.
Trajectories with a poor goodness of fit ( R 2 ≤ 0.8) were excluded from downstream analyses.
Diffusion coefficients were log 1 0 transformed and visualized as frequency distributions, and Gaussian fits were applied to determine peak log( D ) values per cell.
Average MSD curves were generated from pooled high-quality trajectories.
All computational analyses and visualizations were performed in Python (v3.10), using the NumPy 76 , Pandas 77 , SciPy 78 and Matplotlib 79 libraries.
This pipeline conceptually follows established methods for single-molecule motion analysis in plants 80 , adapted here to a Python-based workflow.
Fluorescence intensity quantification of single particles
Fluorescence intensity of ADR1-L1–TagRFP particles was quantified from raw, unprocessed TIFF images acquired by TIRF microscopy (exposure time of 95 ms).
To facilitate particle localization, images were converted to 8-bit format for compatibility with the TrackMate plugin in ImageJ 75 .
Spots were detected using the Laplacian of Gaussian detector with an estimated particle diameter of 0.3 µm and a quality threshold of 20.
Sub-pixel localization and median filtering were enabled for spot detection.
Fluorescence intensity values were extracted from the original raw TIFF images in ImageJ using the coordinates of the detected particles.
Background fluorescence was estimated by measuring the mean grey value within a representative region of interest (ROI) placed in a signal-free area of each image, and this value was subtracted from all particle measurements to obtain background-corrected fluorescence intensities.
Spatial density analysis of ADR1-L1–TagRFP particles
To assess the spatial organization of ADR1-L1–TagRFP particles at the plasma membrane, single-particle coordinates were extracted from TIRF microscopy images using ImageJ.
Particle centroids were identified using the TrackMate plugin 75 , with sub-pixel localization enabled.
Spatial clustering was visualized by applying a 2D Gaussian kernel density estimator to the extracted coordinates using the stat_density_2d_filled() function from the ggplot2 package 81 in R (v4.3.1).
Heatmaps depict local particle density, with warmer colours indicating regions of higher ADR1-L1–TagRFP concentration.
Individual particles are shown as overlaid white points.
To test deviations from complete spatial randomness in ADR1-L1–TagRFP particle distributions, quadrat count analysis was performed using the R package spatstat 82 .
The ROI for each cell was subdivided into a 9 × 8 grid of equal-area quadrats.
Observed particle counts per quadrat were compared with the expected Poisson distribution under complete spatial randomness using a chi-squared ( χ 2 ) goodness-of-fit test.
Distributions with P < 0.05 were considered significantly clustered.
Colocalization of fluorescently tagged proteins was analysed using the JACoP plugin 83 in ImageJ.
ROIs were manually defined, and signal thresholds were individually adjusted for each fluorescence channel to minimize background.
Colocalization was quantified using Mander’s overlap coefficient, and results were averaged across multiple biological replicates, as indicated in the figure legends.
Bimolecular fluorescence complementation and FRET-FLIM assays
For bimolecular fluorescence complementation assays, protoplasts were transfected or N.
benthamiana leaves were infiltrated with Agrobacterium carrying the suppressor of silencing HC-Pro and different pairs of bimolecular fluorescence complementation assay constructs, as shown in the figures.
Fluorescence signals were examined 12 h later using a Leica TCS SP8 laser scanning confocal microscope (Leica).
The excitation wavelengths of YFP and autofluorescence of chlorophyll were 514 nm and 630 nm, respectively.
The emission wavelengths for YFP and chlorophyll were 490–530 nm and 640–700 nm, respectively.
The pinhole was set at 1 Airy unit.
Imaging analyses were performed using Leica Application Suite X (LAS X) software.
The FRET-FLIM assays were performed as previously described 84 .
In brief, protoplasts were transfected with different pairs of GFP and mCherry constructs, as indicated in the figures.
Fluorescence signals were examined 12 h after transfection under a Leica TCS SP8 confocal microscope.
The FRET-FLIM was analysed using LAS X software.
The excitation wavelengths of GFP and mCherry were 488 nm and 588 nm, respectively.
The emission wavelengths for GFP and mCherry were 490–530 nm and 590–620 nm, respectively.
The GFP fluorescence lifetime ( τ ) in a specific ROI was measured by Leica LAS X software, shown in the figures as an average of 14 randomly measured protoplasts for each pair of proteins.
The FRET efficiency ( E ) was calculated by the formula [ E = 1 − ( τ DA / τ D )] (where τ DA represents the GFP lifetime of the donor in the presence of the acceptor and τ D represents the GFP lifetime of the donor alone).
The statistical analysis was performed using one-way ANOVA followed by Tukey test for multiple comparisons.
Total proteins from protoplasts or N.
benthamiana leaves were extracted with 1× native PAGE sample buffer (Invitrogen) containing 1% digitonin and protease inhibitor cocktail.
Protein samples containing 0.25% Coomassie G-250, along with protein molecular weight marker NativeMark unstained protein standard (Thermo Fisher Scientific), were loaded and run on a native PAGE 3–12% Bis-Tris gel (Invitrogen).
Proteins were then transferred to polyvinylidene difluoride membranes (Bio-Rad) using NuPAGE transfer buffer with a Trans-Blot Turbo Transfer System (Bio-Rad), following the manufacturer’s instructions.
Proteins were fixed to the membranes by incubating with 8% acetic acid for 15 min, washed with water and left to dry.
Membranes were subsequently reactivated with methanol to visualize the unstained native protein marker.
Membranes were immunoblotted with the indicated antibodies.
Protein structure prediction and analysis
The 3D structures of the type II CNL proteins and ADR1s were predicted using AlphaFold2 (refs.
23 , 85 ).
Subsequently, the predicted structures were calculated at the spatial positions of membrane boundaries via the Positioning of Proteins in Membranes server 24 , 86 , 87 .
The visualization of the protein structures was performed by PyMOL 88 .
The following antibodies and dilutions were used in this study: anti-HA-peroxidase (1:2,000; Roche); anti-FLAG-peroxidase (1:2,000; Sigma-Aldrich); anti-GFP (1:2,000; Roche); anti-mouse lgG, horseradish peroxidase (HRP)-linked (1:10,000; Cell Signaling Technology); anti-pan myristoylation (1:1,000; MyBioSource); anti-PR1 (1:2,000; Agrisera); anti-rabbit IgG, HRP-linked (1:10,000; Cell Signaling Technology); anti-MYC-HRP (1:2,000; BioLegend); and HRP-labelled streptavidin (10,000; Thermo Fisher Scientific).
Quantification and statistical analysis
Data for quantification analyses are presented as mean ± s.e.m., s.d.
or minimum–maximum boxplot.
Boxplots show the first and third quartiles as bounds of box, split by the medians (lines), with whiskers extending to the minimum and maximum values.
The statistical analyses were performed by Student’s t -test or one-way ANOVA test, followed by the Tukey test.
Group comparisons of fluorescence intensity data were assessed using a generalized linear model with a gamma distribution and log link function using the lme4 package 89 in R (v4.3.1).
Pairwise differences between treatments were evaluated using Tukey-adjusted post-hoc tests.
Data analyses and figure generation were conducted using GraphPad Prism 8 (v8.0.1) or R (v4.3.1).
The number of biological replicates is indicated in the figure legends.
Further information on research design is available in the Nature Portfolio Reporting Summary linked to this article.
All data are available in the main text and Supplementary Information .
Full versions of all gels and blots are provided in Supplementary Fig.
1 .
Gene sequences associated with this study are available from the Arabidopsis Information Resource database and can be accessed by searching the corresponding locus numbers.
The inactive and active ZAR1 structures were obtained from the RCSB Protein Data Bank (PDB; extended PDB IDs: pdb_00006j5w and pdb_00006j5t , respectively).
RNA sequencing data for WT and mpk4 have been deposited in the NCBI Sequence Read Archive (accession number PRJNA1402386 ).
Source data are provided with this paper.
Jones, J.
D.
G., Staskawicz, B.
J.
& Dangl, J.
L.
The plant immune system: from discovery to deployment.
Cell 187 , 2095–2116 (2024).
Article ADS CAS PubMed Google Scholar
Jacob, P.
et al.
Plant “helper” immune receptors are Ca 2+ -permeable nonselective cation channels.
Science 373 , 420–425 (2021).
Article ADS CAS PubMed PubMed Central Google Scholar
Forderer, A.
et al.
A wheat resistosome defines common principles of immune receptor channels.
Nature 610 , 532–539 (2022).
Article ADS PubMed PubMed Central Google Scholar
Bi, G.
et al.
The ZAR1 resistosome is a calcium-permeable channel triggering plant immune signaling.
Cell 184 , 3528–3541.e12 (2021).
Article CAS PubMed Google Scholar
Adachi, H.
et al.
An N-terminal motif in NLR immune receptors is functionally conserved across distantly related plant species.
eLife 8 , e49956 (2019).
Article PubMed PubMed Central Google Scholar
Zhou, J.
M.
& Zhang, Y.
L.
Plant immunity: danger perception and signaling.
Cell 181 , 978–989 (2020).
Lolle, S., Stevens, D.
& Coaker, G.
Plant NLR-triggered immunity: from receptor activation to downstream signaling.
Curr.
Opin.
Immunol.
62 , 99–105 (2020).
Article CAS PubMed PubMed Central Google Scholar
Cui, H., Tsuda, K.
& Parker, J.
E.
Effector-triggered immunity: from pathogen perception to robust defense.
Annu.
Rev.
Plant Biol.
66 , 487–511 (2015).
Saur, I.
M.
L., Panstruga, R.
& Schulze-Lefert, P.
NOD-like receptor-mediated plant immunity: from structure to cell death.
Nat.
Rev.
Immunol.
21 , 305–318 (2021).
Day, B., Dahlbeck, D.
& Staskawicz, B.
J.
NDR1 interaction with RIN4 mediates the differential activation of multiple disease resistance pathways in Arabidopsis .
Plant Cell 18 , 2782–2791 (2006).
Gong, Y., Tian, L., Kontos, I., Li, J.
& Li, X.
Plant immune signaling network mediated by helper NLRs.
Curr.
Opin.
Plant Biol.
73 , 102354 (2023).
Jubic, L.
M., Saile, S., Furzer, O.
J., El Kasmi, F.
& Dangl, J.
L.
Help wanted: helper NLRs and plant immune responses.
Curr.
Opin.
Plant Biol.
50 , 82–94 (2019).
Chai, J., Song, W.
& Parker, J.
E.
New biochemical principles for NLR immunity in plants.
Mol.
Plant Microbe Interact.
36 , 468–475 (2023).
Sun, T.
& Zhang, Y.
MAP kinase cascades in plant development and immune signaling.
EMBO Rep.
23 , e53817 (2022).
Yan, Y., Liu, G., Shen, Q., He, P.
& Shan, L.
Orchestration of plant PRR- and NLR-mediated immunity: protein kinases and beyond.
Mol.
Cell 85 , 3840–3852 (2025).
Huang, Y.
et al.
A trimeric CrRLK1L-LLG1 complex genetically modulates SUMM2-mediated autoimmunity.
Nat.
Commun.
11 , 4859 (2020).
Liu, Y.
et al.
Receptor-like kinases MDS1 and MDS2 promote SUMM2-mediated immunity.
J.
Integr.
Plant Biol.
63 , 277–282 (2021).
Liu, J.
et al.
The malectin-like receptor-like kinase LETUM1 modulates NLR protein SUMM2 activation via MEKK2 scaffolding.
Nat.
Plants 6 , 1106–1115 (2020).
Nitta, Y.
et al.
MEKK2 inhibits activation of MAP kinases in Arabidopsis .
Plant J.
103 , 705–714 (2020).
Yang, Y.
et al.
RNA interference-based screen reveals concerted functions of MEKK2 and CRCK3 in plant cell death regulation.
Plant Physiol.
183 , 331–344 (2020).
Kourelis, J.
et al.
The helper NLR immune protein NRC3 mediates the hypersensitive cell death caused by the cell-surface receptor Cf-4.
PLoS Genet.
18 , e1010414 (2022).
Wang, J.
et al.
Reconstitution and structure of a plant NLR resistosome conferring immunity.
Science 364 , eaav5870 (2019).
Jumper, J.
et al.
Highly accurate protein structure prediction with AlphaFold.
Nature 596 , 583–589 (2021).
Lomize, A.
L., Todd, S.
C.
& Pogozheva, I.
D.
Spatial arrangement of proteins in planar and curved membranes by PPM 3.0.
Protein Sci.
31 , 209–220 (2022).
Tamborski, J.
& Krasileva, K.
V.
Evolution of plant NLRs: from natural history to precise modifications.
Annu.
Rev.
Plant Biol.
71 , 355–378 (2020).
Lee, H.
Y.
et al.
Genome-wide functional analysis of hot pepper immune receptors reveals an autonomous NLR clade in seed plants.
New Phytol.
229 , 532–547 (2021).
Wang, B.
et al.
Protein N-myristoylation: functions and mechanisms in control of innate immunity.
Cell.
Mol.
Immunol.
18 , 878–888 (2021).
Saito, S.
et al.
N-myristoylation and S-acylation are common modifications of Ca 2+ -regulated Arabidopsis kinases and are required for activation of the SLAC1 anion channel.
New Phytol.
218 , 1504–1521 (2018).
Boyle, P.
C.
et al.
Detecting N-myristoylation and S-acylation of host and pathogen proteins in plants using click chemistry.
Plant Methods 12 , 38 (2016).
Liu, F.
et al.
Activation of the helper NRC4 immune receptor forms a hexameric resistosome.
Cell 187 , 4877–4889.e15 (2024).
Zhang, J.
et al.
A Pseudomonas syringae effector inactivates MAPKs to suppress PAMP-induced immunity in plants.
Cell Host Microbe 1 , 175–185 (2007).
Zhang, Z.
et al.
Disruption of PAMP-induced MAP kinase cascade by a Pseudomonas syringae effector activates plant immunity mediated by the NB-LRR protein SUMM2.
Cell Host Microbe 11 , 253–263 (2012).
Huang, S.
et al.
Identification and receptor mechanism of TIR-catalyzed small molecules in plant immunity.
Science 377 , eabq3297 (2022).
Wu, Z.
S., Tian, L., Liu, X.
R., Zhang, Y.
L.
& Li, X.
TIR signal promotes interactions between lipase-like proteins and ADR1-L1 receptor and ADR1-L1 oligomerization.
Plant Physiol.
187 , 681–686 (2021).
Jacob, P.
et al.
Broader functions of TIR domains in Arabidopsis immunity.
Proc.
Natl Acad.
Sci.
USA 120 , e2220921120 (2023).
Saile, S.
C.
et al.
Arabidopsis ADR1 helper NLR immune receptors localize and function at the plasma membrane in a phospholipid dependent manner.
New Phytol.
232 , 2440–2456 (2021).
Grossmann, G.
et al.
Green light for quantitative live-cell imaging in plants.
J.
Cell Sci.
131 , jcs209270 (2018).
Liu, M.
J.
et al.
Extracellular pectin-RALF phase separation mediates FERONIA global signaling function.
Cell 187 , 312–330.e22 (2024).
Article ADS PubMed Google Scholar
Selvaraj, M.
et al.
Activation of plant immunity through conversion of a helper NLR homodimer into a resistosome.
PLoS Biol.
22 , e3002868 (2024).
Ma, S.
et al.
Oligomerization-mediated autoinhibition and cofactor binding of a plant NLR.
Nature 632 , 869–876 (2024).
Contreras, M.
P.
et al.
Sensor NLR immune proteins activate oligomerization of their NRC helpers in response to plant pathogens.
EMBO J.
42 , e111519 (2023).
Huang, C.
Y.
et al.
Subfunctionalization of NRC3 altered the genetic structure of the Nicotiana NRC network.
PLoS Genet.
20 , e1011402 (2024).
Duggan, C.
et al.
Dynamic localization of a helper NLR at the plant-pathogen interface underpins pathogen recognition.
Proc.
Natl Acad.
Sci.
USA 118 , e2104997118 (2021).
Bhattacharjee, S., Halane, M.
K., Kim, S.
H.
& Gassmann, W.
Pathogen effectors target Arabidopsis EDS1 and alter its interactions with immune regulators.
Science 334 , 1405–1408 (2011).
Chen, H.
et al.
Two interacting transcriptional coactivators cooperatively control plant immune responses.
Sci.
Adv.
7 , eabl7173 (2021).
Qi, D., DeYoung, B.
J.
& Innes, R.
W.
Structure-function analysis of the coiled-coil and leucine-rich repeat domains of the RPS5 disease resistance protein.
Plant Physiol.
158 , 1819–1832 (2012).
Jia, A.
et al.
TIR-catalyzed ADP-ribosylation reactions produce signaling molecules for plant immunity.
Science 377 , eabq8180 (2022).
Brodersen, P.
et al.
Arabidopsis MAP kinase 4 regulates salicylic acid- and jasmonic acid/ethylene-dependent responses via EDS1 and PAD4.
Plant J.
47 , 532–546 (2006).
Yu, H.
et al.
Activation of a helper NLR by plant and bacterial TIR immune signaling.
Science 386 , 1413–1420 (2024).
Takagi, M.
et al.
Disruption of the MAMP-induced MEKK1-MKK1/MKK2-MPK4 pathway activates the TNL immune receptor SMN1/RPS6.
Plant Cell Physiol.
60 , 778–787 (2019).
Takagi, M.
et al.
Simultaneous mutations in SMN1 and SUMM2 fully suppress the dwarf and autoimmune phenotypes of Arabidopsis mpk4 mutant.
Plant Signal.
Behav.
17 , 2046412 (2022).
Saile, S.
C.
et al.
Two unequally redundant “helper” immune receptor families mediate Arabidopsis thaliana intracellular “sensor” immune receptor functions.
PLoS Biol.
18 , e3000783 (2020).
Feehan, J.
M.
et al.
Oligomerization of a plant helper NLR requires cell-surface and intracellular immune receptor activation.
Proc.
Natl Acad.
Sci.
USA 120 , e2210406120 (2023).
Wang, Z.
et al.
Plasma membrane association and resistosome formation of plant helper immune receptors.
Proc.
Natl Acad.
Sci.
USA 120 , e2222036120 (2023).
Wu, Z.
et al.
Differential regulation of TNL-mediated immune signaling by redundant helper CNLs.
New Phytol.
222 , 938–953 (2019).
Shen, Q.
et al.
Cytoplasmic calcium influx mediated by plant MLKLs confers TNL-triggered immunity.
Cell Host Microbe 32 , 453–465.e6 (2024).
Liu, X.
et al.
Inflammasome-activated gasdermin D causes pyroptosis by forming membrane pores.
Nature 535 , 153–158 (2016).
Degen, M.
et al.
Structural basis of NINJ1-mediated plasma membrane rupture in cell death.
Nature 618 , 1065–1071 (2023).
David, L.
et al.
NINJ1 mediates plasma membrane rupture by cutting and releasing membrane disks.
Cell 187 , 2224–2235.e16 (2024).
Liu, J.
et al.
The antagonistic role of an E3 ligase pair in regulating plant NLR-mediated autoimmunity and fungal pathogen resistance.
Cell Host Microbe 32 , 1114–1128.e10 (2024).
Bonardi, V.
et al.
Expanded functions for a family of plant intracellular immune receptors beyond specific recognition of pathogen effectors.
Proc.
Natl Acad.
Sci.
USA 108 , 16463–16468 (2011).
Castel, B.
et al.
Diverse NLR immune receptors activate defence via the RPW8-NLR NRG1.
New Phytol.
222 , 966–980 (2019).
Liu, H., Li, J., Xu, Y., Hua, J.
& Zou, B.
ISWI chromatin remodeling factors repress PAD4-mediated plant immune responses in Arabidopsis .
Biochem.
Biophys.
Res.
Commun.
583 , 63–70 (2021).
Ordon, J.
et al.
Generation of chromosomal deletions in dicotyledonous plants employing a user-friendly genome editing toolkit.
Plant J.
89 , 155–168 (2017).
Lapin, D.
et al.
A coevolved EDS1-SAG101-NRG1 module mediates cell death signaling by TIR-domain immune receptors.
Plant Cell 31 , 2430–2455 (2019).
Qi, T.
et al.
NRG1 functions downstream of EDS1 to regulate TIR-NLR-mediated plant immunity in Nicotiana benthamiana .
Proc.
Natl Acad.
Sci.
USA 115 , E10979–E10987 (2018).
Wu, C.
H.
et al.
NRC4 gene cluster is not essential for bacterial flagellin-triggered immunity.
Plant Physiol.
182 , 455–459 (2020).
Ma, X.
et al.
Ligand-induced monoubiquitination of BIK1 regulates plant immunity.
Nature 581 , 199–203 (2020).
Nam, K.
H.
& Li, J.
BRI1/BAK1, a receptor kinase pair mediating brassinosteroid signaling.
Cell 110 , 203–212 (2002).
He, P., Shan, L.
& Sheen, J.
The use of protoplasts to study innate immune responses.
Methods Mol.
Biol.
354 , 1–9 (2007).
Yu, X.
et al.
A phospho-switch constrains BTL2-mediated phytocytokine signaling in plant immunity.
Cell 186 , 2329–2344.e20 (2023).
Oh, S.
K.
et al.
In planta expression screens of Phytophthora infestans RXLR effectors reveal diverse phenotypes, including activation of the Solanum bulbocastanum disease resistance protein Rpi-blb2.
Plant Cell 21 , 2928–2947 (2009).
DeFalco, T.
A.
et al.
Using GCaMP3 to study Ca 2+ signaling in Nicotiana species.
Plant Cell Physiol.
58 , 1173–1184 (2017).
Tinevez, J.
Y.
et al.
TrackMate: an open and extensible platform for single-particle tracking.
Methods 115 , 80–90 (2017).
Harris, C.
R.
et al.
Array programming with NumPy.
Nature 585 , 357–362 (2020).
McKinney, W.
Data structures for statistical computing in Python.
Proceedings of the 9th Python in Science C onference (eds van der Walt, S.
& Millman, J.) 51–56 (2010).
Virtanen, P.
et al.
SciPy 1.0: fundamental algorithms for scientific computing in Python.
Nat.
Methods 17 , 261–272 (2020).
Hunter, J.
D.
Matplotlib: a 2D graphics environment.
Comput.
Sci.
Eng.
9 , 90–95 (2007).
Hosy, E., Martinière, A., Choquet, D., Maurel, C.
& Luu, D.
T.
Super-resolved and dynamic imaging of membrane proteins in plant cells reveal contrasting kinetic profiles and multiple confinement mechanisms.
Mol.
Plant 8 , 339–342 (2015).
Villanueva, R.
A.
M.
& Chen, Z.
J.
ggplot2: Elegant Graphics for Data Analysis (2nd ed.).
Meas.
Interdiscip.
Res.
17, 160–167 (2016).
Baddeley, A., Rubak, E.
& Turner, R.
Spatial Point Patterns: Methodology and Applications with R (Chapman and Hall/CRC, 2016).
Bolte, S.
& Cordelières, F.
P.
A guided tour into subcellular colocalization analysis in light microscopy.
J.
Microsc.
224 , 213–232 (2006).
Article CAS PubMed MathSciNet Google Scholar
Varadi, M.
et al.
AlphaFold Protein Structure Database: massively expanding the structural coverage of protein-sequence space with high-accuracy models.
Nucleic Acids Res.
50 , D439–D444 (2022).
Lomize, M.
A., Pogozheva, I.
D., Joo, H., Mosberg, H.
I.
& Lomize, A.
L.
OPM database and PPM web server: resources for positioning of proteins in membranes.
Nucleic Acids Res.
40 , D370–D376 (2012).
Lomize, A.
L.
et al.
Membranome 3.0: database of single-pass membrane proteins with AlphaFold models.
Protein Sci.
31 , e4318 (2022).
Janson, G., Zhang, C., Prado, M.
G.
& Paiardini, A.
PyMod 2.0: improvements in protein sequence-structure analysis and homology modeling within PyMOL.
Bioinformatics 33 , 444–446 (2017).
Bates, D., Mächler, M., Bolker, B.
M.
& Walker, S.
C.
Fitting linear mixed-effects models using lme4.
J.
Stat.
Softw.
67 , 1–48 (2015).
We thank the Arabidopsis Biological Resource Center for providing the Arabidopsis T-DNA insertion lines; J.
E.
Parker, J.
Jones, J.
Dangl, J.
Stuttmann, B.
Staskawicz, S.
Kamoun, J.
Hua and Z.
Fu for providing various mutant seeds; E.
Nielsen and Q.
Ma for critically reading the manuscript; and L.S.
and P.H.
laboratory members for discussing and commenting on the experiments.
The study was supported by the US National Institutes of Health (NIH; R35GM149197) to P.H., NIH (R35GM144275) to L.S.
and the PEW Latin American Fellows Program to F.A.O.-M.
These authors contributed equally: Dongdong Ge, Fausto Andres Ortiz-Morea, Yingpeng Xie
Department of Biochemistry & Biophysics, Texas A&M University, College Station, TX, USA
Dongdong Ge, Fausto Andres Ortiz-Morea, Libo Shan & Ping He
Department of Molecular, Cellular, and Developmental Biology, University of Michigan, Ann Arbor, MI, USA
Fausto Andres Ortiz-Morea, Yingpeng Xie, In-Cheol Yeo, Qiaochu Shen, Yulu Zhou, Guangchao Liu, Liang Kong, Libo Shan & Ping He
Amazonian Research Center Cimaz-Macagual, University of the Amazon, Florencia, Colombia
Search author on: PubMed Google Scholar
D.G., F.A.O.-M., Y.X., P.H.
and L.S.
conceived the project, designed the experiments, analysed the data and wrote the manuscript with inputs from all authors.
D.G.
performed most of the genetic and biochemical assays.
F.A.O.-M.
performed most of the cell biology assays.
Y.X.
led the efforts in revision together with Q.S.
I.-C.Y.
contributed to the SUMM2 myristoylation assays.
Y.Z.
and G.L.
contributed to the biochemical and microscopic assays.
L.K.
contributed to the FRET-FLIM assays.
Correspondence to Libo Shan or Ping He .
The authors declare no competing interests.
Nature thanks the anonymous reviewers for their contribution to the peer review of this work.
Peer reviewer reports are available.
Publisher’s note Springer Nature remains neutral with regard to jurisdictional claims in published maps and institutional affiliations.
Extended data figures and tables
Extended Data Fig.
1 The N-myristoylation motif is a common feature of Arabidopsis CNLs without a MADA motif.
a , Domain architecture of a canonical CNL protein indicating the locations of the MADA and MGxxxS/T motifs.
Consensus sequence logos generated by MEME and corresponding alignments are shown for the MADA motif (NRC4, ZAR1) and the MGxxxS/T motif (SUMM2, RPS5).
b , The α1 helix of active ZAR1 resistosome (PDB ID: 6J5T ), but not inactive ZAR1 (PDB ID: 6J5W ), protrudes into the PM.
The membrane (gray, spheres) targeting was modeled by PPM 3.0, and images were created using PyMOL.
c , The α1 helix of SUMM2 and RPS5 coiled-coil (CC) domains is anchored to the PM.
The structures of SUMM2 ( P60838 ) and RPS5 ( O64973 ) CC domains were predicted by AlphaFold2, and the membrane targeting was modeled by PPM 3.0.
d , Phylogenetic analysis of CC domains (amino acids 1–160) of Arabidopsis 41 CNLs and 5 RNLs divides them into three subgroups.
Amino acid sequences of N-terminal domains were aligned using ClustalW.
The phylogenetic tree was constructed via the NJ method with 1000 bootstrap values in MEGA7.
Arabidopsis CNLs were divided into MADA CNL (CC-NLR), MGxxxS/T CNL (CC G10 -NLR), and Helper RNL (CC R -NLR) subgroups.
Extended Data Fig.
2 The majority of MGxxxS/T CNLs are predicted to anchor to membranes.
Most MGxxxS/T type II CNLs were predicted to anchor to membranes via their α1 helix.
The structure of AT1G61180/UNI ( Q940K0 ), AT5G05400 ( Q9FLB4 ), AT1G12290/L5 ( P60839 ), AT4G10780 ( O82484 ), AT1G12210 ( Q8L3R3 ), AT1G61310 ( O64789 ), AT1G63350 ( Q9C8T9 ), AT1G63360 ( Q9C8T9 ), AT1G62630 ( Q9SI85 ), AT5G63020/SUT1 ( Q8RXS5 ) and AT5G47260 ( Q9LVT3 ) CC domains were predicted by AlphaFold2.
The membrane targeting was modeled by PPM 3.0, and images were created using PyMOL.
Extended Data Fig.
3 N-myristoylation regulates SUMM2 PM localization and protein stability.
a , SUMM2 CC , but not SUMM2 CC/G2A , is myristoylated in planta.
SUMM2 CC -GFP, or SUMM2 CC/G2A -GFP was expressed in N.
benthamiana .
Total proteins were immunoprecipitated using GFP-trap magnetic beads and immunoblotted with α-myristoylation (top) or α-GFP (bottom) antibody.
b , Silencing MEKK1 does not affect SUMM2 myristoylation.
Two-week-old pSUMM2::SUMM2-FLAG transgenic plants were inoculated with Agrobacterium carrying the indicated VIGS vectors.
Alk12 (alkynyl myristic acid) was inoculated into plants two weeks after VIGS.
Total proteins were extracted and incubated with biotin-PEG3-azide for click chemistry.
Myristoylated proteins were enriched using streptavidin resin and detected by immunoblotting with α-FLAG antibody (top).
Input proteins were detected by immunoblotting with α-FLAG antibody before immunoprecipitation (middle).
Coomassie brilliant blue (CBB) staining of Rubisco proteins (RBC) is shown as the loading control (bottom).
c , SUMM2 and SUMM2 ac have a similar level of myristoylation in planta.
SUMM2-HA or SUMM2 ac -HA was expressed in N.
benthamiana leaves, followed by treatment with Alk12 (alkynyl myristic acid) for in vivo metabolic labeling of myristoylated proteins.
Total proteins were extracted and subjected to click chemistry using biotin-PEG3-azide or mock treatment.
Myristoylated proteins were then pulled down using streptavidin resin, followed by immunoblotting with α-HA antibody (top).
Input proteins were analyzed via immunoblotting using α-HA antibody before immunoprecipitation (middle), and CBB staining of RBC is shown as the loading control (bottom).
d , Unlike SUMM2-GFP, SUMM2 G2A -GFP exhibits a dispersed pattern in the cytoplasm and reduced PM association.
SUMM2-GFP or SUMM2 G2A -GFP was expressed in N.
benthamiana and imaged at 36 hr post-infiltration of Agrobacterium with a confocal microscope.
The PM was stained with FM4-64.
Scale bar, 20 µm.
Insets denote the regions magnified in the bottom panels.
Scale bar, 5 μm (top).
Line scan analysis of fluorescence intensity along the white dotted lines shows that SUMM2-GFP signal largely overlaps with FM4-64 peak, while the SUMM2 G2A -GFP signal is spatially shifted, indicating altered subcellular distribution with reduced co-localization (bottom).
e , Quantitative co-localization analysis of SUMM2-GFP and SUMM2 G2A -GFP with FM4-64 using Mander’s overlap coefficient.
Data are shown as mean ± SD with each point representing one cell ( n = 16).
f , The N-myristoylation regulates SUMM2 protein stability.
SUMM2-HA or SUMM2 G2A -HA was expressed in N.
benthamiana leaves for two days after Agrobacterium infiltration, followed by protein extraction and immunoblotting using an α-HA antibody (upper).
CBB staining of RBC serves as the protein loading control (bottom).
Relative band intensities of immunoblotting proteins normalized to input proteins were labeled.
The value of the first sample was set as 1.0.
g .
SUMM2 G2A protein levels are stabilized by MG132 treatment.
Agrobacterium carrying p35S::SUMM2 G2A -HA was inoculated into N.
benthamiana leaves.
After 60 hr, leaves were treated with dimethyl sulfoxide (DMSO, Mock) or 50 μM MG132 for 6 hr.
SUMM2 G2A -HA proteins were immunoblotted using an α-HA antibody (top) with CBB staining for RBC as the loading control (bottom).
In immunoblots ( b, c, f, g ), RBCs were run on the same gels and used as loading controls.
Statistical analysis was performed using a two-tailed Student’s t -test ( e ).
Experiments were repeated three times with similar results.
For gel source data, see Supplementary Fig.
1 .
Extended Data Fig.
4 Mutational analysis of SUMM2 ac and the potential involvement of Ca 2+ signaling in its cell death induction.
a , The N-terminal domains of SUMM2 (residues 1–108), ZAR1 (residues 1–111), Sr35 (residues 1–113), NRG1.1 (residues 1–114), and ADR1 (residues 1–112) were aligned by ClustalW.
Numbers denote amino acid positions.
Some key functional residues are noted on the top and boxed, and their corresponding residues on SUMM2 are indicated by asterisks.
b , The L22 residue is not required for SUMM2 ac -mediated cell death.
SUMM2 ac or SUMM2 ac/L22A was expressed in N.
benthamiana leaves.
The ratio indicates the number of leaves showing cell death to the total number of leaves inoculated with Agrobacterium .
The protein expression is shown at the bottom.
c , D12 and E13 are not required for SUMM2 ac cell death induction.
Quantification of relative cell death was performed for Fig.
1h .
Images in Fig.
1h were converted to a grayscale, and the mean value of the inoculated area was scored after subtracting the background of the non-inoculated area by ImageJ.
Data are shown as means ± SEM with SUMM2 ac set to 1.0 ( n = 6).
d , The expression of SUMM2 ac triggers intracellular Ca 2+ increases in N.
benthamiana Ca 2+ biosensor GCaMP3 transgenic plants.
DEX::SUMM2-HA or DEX::SUMM2 ac -HA was expressed in the leaves of N.
benthamiana Ca 2+ biosensor GCaMP3 transgenic plants.
Two days post Agrobacterium infiltration, the leaves were treated with 50 μM DEX and 0.001% [v/v] Silwet L-77.
The GCaMP3 signal was measured in leaf discs right after DEX treatment using a plate reader.
Absolute fluorescence values for each sample were normalized to the control samples without Agrobacterium infiltration and presented as F/Feq.
Data are shown as mean ± SD ( n = 6).
e , Ca 2+ channel blockers LaCl 3 and GdCl 3 suppress cell death triggered by SUMM2 ac .
Agrobacterium carrying SUMM2 ac -HA was infiltrated into N.
benthamiana leaves.
At 12 hr post Agrobacterium infiltration, the leaves were inoculated with H 2 O (-), 1 mM LaCl 3 or GdCl 3 .
The cell death was documented under UV light two days after Agrobacterium infiltration.
The protein expression is shown at the bottom (left).
Images were converted to grayscale, and the mean value of the inoculated area was scored after subtracting the background of the non-inoculated area by ImageJ.
Data are shown as means ± SEM with SUMM2 ac set to 1.0 ( n = 6) (right).
In immunoblots ( b, e ), RBCs were run on the same gels and used as loading controls.
Statistical analysis was performed using one-way ANOVA followed by the Tukey test ( c, e ).
Experiments were repeated three times with similar results.
For gel source data, see Supplementary Fig.
1 .
Extended Data Fig.
5 The EDS1-PAD4-ADR1s module is involved in mekk1 cell death.
a , Expression of ADR1 or ADR1-L2 in adr1/L1/L2 restores the cell death triggered by silencing MEKK1 .
The plant images were taken 3 weeks after inoculation with Agrobacterium carrying the indicated VIGS vectors in two independent p35S::gADR1-HA (1 & 2) and p35S::ADR1-L2-HA (3 & 4) transgenic lines in adr1/L1/L2 (top).
Scale bar, 1 cm.
Protein expression of transgenic lines is shown by immunoblotting using an α-HA antibody (upper panel) with CBB staining of RBC as the loading control (bottom panel).
b , Expression of EDS1 in eds1-2 restores the cell death triggered by silencing MEKK1 .
Two lines of transgenic plants carrying the p35S::EDS1-HA (1 & 2) in eds1-2 are shown.
Scale bar, 1 cm.
Protein expression in transgenic lines is shown at the bottom.
c , The adr1/L1/L2 , eds1-2 , and pad4-1 mutants suppress cell death and H 2 O 2 accumulation triggered by RNAi- MEKK1 .
Quantification of relative trypan blue-stained cell death (top) and 3,3′-diaminobenzidine (DAB)-stained H 2 O 2 accumulation (bottom) is presented for Fig.
2b .
Images in Fig.
2b were converted to grayscale, and the mean value of the area was scored by ImageJ.
Data are shown as means ± SEM with RNAi-Ctrl (-) in WT set to 1.0 ( n = 5).
d , The adr1/L1/L2 and summ2 mutants augment the fresh weight of mekk1 .
The quantification was performed for Fig.
2d .
Data are shown as mean ± SEM ( n = 5).
e , The adr1/L1/L2/ mutant suppresses the elevated expression of PR1 and PR2 in mekk1 .
RT-qPCR was performed with the detached leaves from Fig.
2d .
The expression of PR1 and PR2 was normalized to the expression of UBQ10 .
The data are shown as mean ± SD ( n = 3).
f , The growth defects of mpk4 are reduced in adr1/L1/L2/mpk4 and mekk2/mpk4 mutants.
Three-week-old plants grown on 1/2 MS medium with the indicated genotypes are shown.
Scale bar, 0.5 cm.
g , The adr1/L1/L2 and mekk2 mutants augment the fresh weight of mpk4 .
The quantification was performed with the detached leaves from ( f ).
Data are shown as mean ± SEM ( n = 5).
h , The adr1/L1/L2 mutant suppresses the elevated expression of PR1 and PR2 in mpk4 .
RT-qPCR was performed with the detached leaves from ( f ).
The expression of PR1 and PR2 was normalized to the expression of UBQ10 .
Data are shown as mean ± SD ( n = 3).
i , SUMM2 ac -triggered cell death and ion leakage are attenuated in the N.
benthamiana eds1 mutant.
SUMM2 or SUMM2 ac was expressed in WT and eds1 N.
benthamiana plant leaves.
Cell death was documented under UV light at 24 hpi and 42 hpi (top).
At 18 hpi, 1 cm-diameter leaf discs were collected and immersed in water for the ion leakage assay.
Conductivity was measured at 6 hr and 24 hr after immersing.
The data are shown as three repeats ( n = 15, bottom).
Box plots show the first and third quartiles as bounds of box, split by the medians (lines), with whiskers extending to the minimum and maximum values.
j , Arabidopsis EDS1-PAD4, but not EDS1-SAG101, restores SUMM2 ac -triggered cell death in the N.
benthamiana epss mutant.
DEX::SUMM2 ac -HA and ADR1-L1-TagRFP were co-expressed in the N.
benthamiana epss mutant with either a vector control (-), EDS1-FLAG and PAD4-FLAG, or EDS1-FLAG and SAG101-FLAG.
Two days post Agrobacterium infiltration, plants were treated with 50 μM DEX for 6 hr, and images were captured using a confocal laser scanning microscope (left bottom, Scale bar, 10 μm).
Cell death was imaged 24 hpi under UV light (left top).
Quantification of relative cell death is shown on the right.
Images were converted to grayscale, and the mean intensity of the inoculated area was measured using ImageJ, with background signal from the non-inoculated area subtracted.
Data represent means ± SEM, normalized to SUMM2 ac /ADR1-L1-TagRFP (set to 1.0, n = 6).
k , SUMM2 ac induces cell death independently of NRG1.
Agrobacterium carrying DEX::SUMM2 ac -HA (top) or DEX::RBA1-HA (bottom) was inoculated into WT and nrg1-1 N.
benthamiana leaves.
After 30 hr, the leaves were treated with 50 µM DEX for 24 hr, and cell death was documented under UV light.
RBA1, but not SUMM2 ac -induced cell death, was reduced in the nrg1-1 mutant.
In immunoblots ( a, b ), RBCs were run on the same gels and used as loading controls.
Statistical analysis was performed using one-way ANOVA followed by the Tukey test ( c, d, e, g, h, j ) and a two-tailed Student’s t -test ( i ).
Experiments were repeated three times with similar results.
For gel source data, see Supplementary Fig.
1 .
Extended Data Fig.
6 The EDS1-PAD4-ADR1s module functions downstream of MEKK2 and SUMM2.
a , Plant dwarfism and growth defects triggered by overexpressing MEKK2 in WT are alleviated in the adr1/L1/L2 mutant.
A total of 32 and 34 independent primary (T 1 ) transgenic plants carrying p35S::MEKK2-HA in WT or adr1/L1/L2 were characterized, respectively.
Four-week-old plants representing different levels of dwarfism labeled with the percentage of the total plants are shown (top).
Scale bar, 1 cm.
Protein expression of MEKK2-HA in transgenic plants with CBB staining for RBC as the loading control is shown on the bottom.
b , c , The cell death and H 2 O 2 accumulation triggered by overexpressing MEKK2 in WT are alleviated in the adr1/L1/L2 mutant.
Detached leaves from ( a ) were stained by trypan blue for cell death and DAB for H 2 O 2 accumulation.
Scale bar, 0.5 cm ( b ).
Images were converted to grayscale, and the mean value of the area was scored by ImageJ.
Quantification data are shown as means ± SEM with WT set to 1.0 ( n = 5).
d , The adr1/L1/L2 mutant suppresses the PR gene expression triggered by overexpressing MEKK2.
RT-qPCR was performed with the detached leaves from ( a ), and the expression of PR1 and PR2 was normalized to UBQ10 .
The data are shown as mean ± SD ( n = 3).
e, f , Plant growth defects triggered by overexpressing MEKK2 are alleviated in eds1-2 .
A total of 42 and 48 independent T 1 transgenic plants carrying p35S::MEKK2-HA in WT and eds1-2 were characterized, respectively.
Four-week-old plants representing different levels of dwarfism labeled with the percentage of total plants are shown in ( e) .
Scale bar, 1 cm.
Protein expression in transgenic plants is shown in ( f) .
Total proteins were immunoblotted using an α-HA antibody (top panel).
CBB staining for RBC is shown as the loading control (bottom panel).
g , Protein expression of SUMM2 ac -HA in transgenic plants.
Total proteins were isolated from plants in Fig.
2e and immunoblotted using an α-HA antibody (top).
CBB staining for RBC is shown as the loading control (bottom).
h , The adr1/L1/L2 mutant suppresses the PR gene expression triggered by overexpressing SUMM2 ac .
RT-qPCR analysis was performed with the detached leaves from Fig.
2e , and the expression of PR1 and PR2 was normalized to UBQ10 .
The data are shown as the mean ± SD ( n = 3).
i , Plant growth defects triggered by overexpressing ADR1-HA are similar in WT and summ2-8 .
A total of 32 and 34 independent T 1 transgenic plants carrying p35S::gADR1-HA in WT and summ2-8 were characterized, respectively.
Two representative three-week-old plants with growth defects are shown (top).
Scale bar, 1 cm.
Protein expression in transgenic plants is shown in the bottom.
j , Plant growth defects triggered by expressing HopAI1 are alleviated in the adr1/L1/L2 and summ2-8 mutants.
A total of 55, 26, and 36 independent T 1 transgenic plants carrying p35S::HopAI1-HA in WT, adr1/L1/L2 , and summ2-8 were characterized, respectively.
Three-week-old plants representing different levels of dwarfism labeled with the percentage of total plants are shown (top).
Scale bar, 1 cm.
Total proteins in transgenic plants were immunoblotted using an α-HA antibody with CBB staining for RBC as the loading control (bottom).
In immunoblots ( a, f, g, i, j ), RBCs were run on the same gels and used as loading controls.
Statistical analysis was performed using one-way ANOVA followed by the Tukey test ( c, d, h ).
Experiments were repeated three times with similar results.
For gel source data, see Supplementary Fig.
1 .
Extended Data Fig.
7 SUMM2 ac promotes the association between EDS1/PAD4 and ADR1-L1.
a, b , SUMM2 is in close proximity to EDS1 and PAD4, but not ADR1-L1, with the Förster resonance energy transfer (FRET)-fluorescence lifetime imaging (FLIM) assays.
The indicated protein pairs, SUMM2-GFP and EDS1-mCherry, PAD4-mCherry, or ADR1-L1-mCherry, were expressed in Arabidopsis WT protoplasts for 16 hr, and FRET-FLIM was visualized using a confocal laser scanning microscope.
Localization of the SUMM2-GFP and EDS1-mCherry/PAD4-mCherry/ADR1-L1-mCherry is shown in the first column (green) and second column (red), respectively ( a ).
The lifetime ( τ ) distribution (third column), and apparent FRET efficiency (fourth column) are presented as pseudo-color images according to the scale.
The GFP mean fluorescence lifetime ( τ ) values were statistically analyzed and are shown as mean ± SEM ( n = 15) ( b ).
Scale bar, 10 µm.
c , EDS1-PAD4 interaction in WT and adr1/L1/L2 .
PAD4-FLAG or a vector control (-) was coexpressed with EDS1-HA in Arabidopsis WT or adr1/L1/L2 protoplasts.
Total proteins were immunoprecipitated with α-FLAG affinity beads and immunoblotted by an α-FLAG or α-HA antibody (top two panels).
Proteins before immunoprecipitation are shown as input controls (bottom two panels).
d , SUMM2 associates with EDS1 and PAD4, but not SAG101.
A vector control (-) or SUMM2-HA was co-expressed with EDS1-FLAG, as well as PAD4-FLAG or SAG101-FLAG in Arabidopsis protoplasts.
Total proteins were immunoprecipitated with α-HA affinity beads and immunoblotted with an α-FLAG or α-HA antibody (top two panels).
Proteins before immunoprecipitation are shown as input controls (bottom two panels).
e , SUMM2 ac promotes the association of EDS1-PAD4 with ADR1-L1 in FRET-FLIM assays.
PAD4-GFP/EDS1-FLAG were co-expressed with ADR1-L1-mCherry in the presence of SUMM2 or SUMM2 ac in Arabidopsis protoplasts for 16 hr, and FRET-FLIM was visualized using a confocal laser scanning microscope.
Localization of the PAD4-GFP and ADR1-L1-mCherry is shown in the first column (green) and second column (red), respectively.
The lifetime ( τ ) distribution (third column), and apparent FRET efficiency (fourth column) are presented as pseudo-color images according to the scale.
The GFP mean fluorescence lifetime ( τ ) values are presented in Fig.
2i .
f , SUMM2 ac promotes the association of EDS1-PAD4 with ADR1-L1 in Co-IP assays.
ADR1-L1-FLAG was co-expressed with a vector (-) or EDS1-HA/PAD4-HA in the presence or absence of DEX::SUMM2 ac -GFP or DEX::SUMM2-GFP in N.
benthamiana .
Two days post-infiltration of Agrobacterium carrying different constructs, SUMM2 was induced by 50 μM DEX treatment for 4 hr, and proteins were extracted and subjected to immunoprecipitation with α-HA affinity beads, followed by immunoblotting using an α-FLAG or α-HA antibody (top two panels).
Proteins before immunoprecipitation are shown as input controls (bottom three panels).
g , MEKK2 promotes the association of EDS1-PAD4 with ADR1-L1 in Co-IP assays.
ADR1-L1-FLAG was co-expressed with a vector (-) or EDS1-HA/PAD4-HA with or without MEKK2-MYC in Arabidopsis WT protoplasts.
Total proteins were immunoprecipitated with α-HA affinity beads and immunoblotted by an α-FLAG or α-HA antibody (top two panels).
Proteins before immunoprecipitation are shown as input controls (bottom two panels).
h , HopAI1 promotes the association of EDS1-PAD4 with ADR1-L1 in Arabidopsis protoplasts.
ADR1-L1-FLAG was co-expressed with a vector (-) or EDS1-HA/PAD4-HA with or without HopAI1-MYC in Arabidopsis protoplasts.
Total proteins were immunoprecipitated with α-HA affinity beads and immunoblotted by an α-FLAG or α-HA antibody (top two panels).
Proteins before immunoprecipitation are shown as input controls (bottom three panels).
i , SUMM2 ac exhibits reduced interaction with PAD4 compared to SUMM2.
PAD4-FLAG was co-expressed with SUMM2-HA or SUMM2 ac -HA in Arabidopsis WT protoplasts.
Total proteins were immunoprecipitated with α-HA affinity beads and immunoblotted by an α-FLAG or α-HA antibody (top two panels).
Proteins before immunoprecipitation are shown as input controls (bottom two panels).
j , SUMM2 ac promotes EDS1-PAD4 oligomerization in the presence of ADR1-L1.
EDS1-GFP, PAD4-GFP, and ADR1-L1-FLAG were co-expressed with or without SUMM2 ac -HA in Arabidopsis protoplasts.
Proteins were analyzed by BN-PAGE or regular SDS-PAGE and immunoblotted with an α-GFP, α-FLAG, or α-HA antibody.
In immunoblot ( j ), RBCs were run on the same gels and used as loading controls.
Statistical analysis was performed using one-way ANOVA followed by the Tukey test ( b ).
Experiments were repeated three times with similar results.
For gel source data, see Supplementary Fig.
1 .
Extended Data Fig.
8 The potential involvement of TIR enzymatic activity in the SUMM2-EDS1-PAD4-ADR1s cell death pathway.
a , TNLs are upregulated in the mpk4 mutant.
ETI-related genes, including ADR1s, EDS1, PAD4, NDR1 , and some of TNLs , are up-regulated in the mpk4 mutant.
The original FPKM (Fragments Per Kilobase per Million mapped fragments) values were adjusted by normalized genes/rows using GraphPad for the heatmap.
The data were extracted from RNA-seq analysis of WT and mpk4 with three biological repeats.
b, c , Nicotinamide (NAM) treatment enhances SUMM2 ac association with EDS1 and PAD4.
EDS1-FLAG (b) or PAD4-FLAG (c) was co-expressed with a vector control (-) or SUMM2 ac -HA in Arabidopsis protoplasts with or without 10 mM NAM for 12 hr.
Total proteins were immunoprecipitated with α-HA affinity beads and immunoblotted with an α-FLAG or α-HA antibody (top two panels).
Proteins before immunoprecipitation are shown as input controls (bottom two panels).
d , SUMM2 ac -induced cell death and ion leakage are suppressed by NAM treatment.
SUMM2 or SUMM2 ac was expressed with or without 10 mM NAM into WT N.
benthamiana leaves.
The cell death was documented under UV light at 36 hr post-infiltration (top).
Leaf samples were collected at 30 hr post-infiltration for the ion leakage assay, and data are shown as three replicates ( n = 12) (bottom).
e , SUMM2 ac -induced intracellular Ca 2+ influx is suppressed by NAM treatment.
Agrobacterium carrying DEX::SUMM2-HA or DEX::SUMM2 ac -HA was inoculated into N.
benthamiana calcium sensor GCaMP3 plants with or without 10 mM NAM.
After 30 hr, leaves were treated with 20 μM DEX, and the GCaMP3 signal was measured at a 5 min interval in leaf discs right after DEX treatment using a plate reader.
Ft: the fluorescence value at each capture time (t).
F0: the baseline value captured at t = 0.
Ft-F0: absolute fluorescence changes at time t relative to the baseline.
(Ft-F0)/F0: the relative GCaMP3 intensity.
Data represent the mean ± SD from three independent experiments.
Total sample sizes from the three replicates were: SUMM2 ( n = 20), SUMM2 + NAM ( n = 22), SUMM2 ac ( n = 17), and SUMM2 ac + NAM ( n = 20).
f , SUMM2 ac -induced ADR1-L1 puncta formation is suppressed by NAM treatment.
ADR1-L1-TagRFP was co-expressed with DEX::SUMM2-HA or DEX::SUMM2 ac -HA, as well as 10 mM NAM in N.
benthamiana leaves.
After 36 hr, 20 μM DEX was treated for 6 hr, and the images were taken using confocal laser scanning microscopy (top).
The puncta were quantified by Fiji and presented as three replicates ( n = 13, bottom).
Box plots in d and f show the first and third quartiles as bounds of the box, split by the medians (lines), with whiskers extending to the minimum and maximum values.
Scale bar, 10 μm.
Statistical analysis was performed using one-way ANOVA followed by the Tukey test ( d, f ).
Experiments were repeated three times with similar results.
For gel source data, see Supplementary Fig.
1 .
Extended Data Fig.
9 The active SUMM2 induces the formation of ADR1-L1 puncta before the occurrence of cell death in plants.
a , Self-association of ADR1-L1.
The ADR1-L1-nYFP and ADR1-L1-cYFP were co-expressed in N.
benthamiana for two days by Agrobacterium infiltration, and YFP signals were detected using a confocal laser scanning microscope.
FM4-64 was used as a PM marker.
Fluorescence intensities were measured along the dotted line (bottom).
Scale bar, 25 μm (left).
Quantification of co-localization between ADR1-L1-GFP and FM4-64 in N.
benthamiana epidermal cells using Mander’s overlap coefficient.
Data are shown as mean ± SD with each dot representing an individual cell ( n = 16).
b , SUMM2 ac stimulates ADR1-L1-YFP to shift from a uniformly to discontinuously distributed PM localization along the cell periphery under the confocal microscope.
The ADR1-L1-nYFP and ADR1-L1-cYFP were co-expressed with the vector control (-), DEX::SUMM2-HA, or DEX::SUMM2 ac -HA in N.
benthamiana leaves for two days, and the images were taken using confocal laser scanning microscopy at 4 hr post 50 μM DEX induction.
The top panel shows single-plane images, and the bottom panel shows maximum projections from 16 images with a z-step of 1 µm.
Scale bar, 25 μm.
c , SUMM2 ac induces the immobile ADR1-L1-YFP puncta.
Time-lapse dynamics analysis with the leaves from ( b ) shows that ADR1-L1-YFP puncta are static with a period of 75 s.
Scale bar, 25 μm.
d , Complementation of ADR1-L1-TagRFP in adr1/L1/L2 restores cell death triggered by silencing MEKK1 .
Plant images were taken three weeks after inoculation with Agrobacterium carrying the indicated VIGS vectors (Ctrl or MEKK1 ) in two independent p35S::ADR1-L1-TagRFP-HA transgenic lines in adr1/L1/L2 (top).
Scale bar, 1 cm.
Protein expression of transgenic lines is shown by immunoblotting using an α-HA antibody with CBB staining of RBC as the loading control (bottom).
1, 2, 3, and 4 correspond to plants on the top.
e , SUMM2 ac -induced ADR1-L1-TagRFP puncta formation depends on EDS1 and PAD4 in N.
benthamiana .
ADR1-L1-TagRFP was co-expressed with DEX::SUMM2 ac -HA in N.
benthamiana .
Two days post-infiltration, SUMM2 ac was induced by 50 μM DEX treatment, and the RFP signal was observed with confocal laser scanning microscopy 5 hr after DEX treatment.
Scale bar, 25 μm.
f , SUMM2 ac induces ADR1-L1-TagRFP puncta independently of NRG1.
Agrobacterium carrying DEX::SUMM2 ac -HA and p35S::ADR1-L1-TagRFP was inoculated into WT and nrg1-1 N.
benthamiana leaves.
After 30 hr, the leaves were treated with 50 µM Dex for 6 hr, and images were taken using confocal laser scanning microscopy.
Scale bar, 10 μm.
g , Formation of ADR1-L1-TagRFP puncta occurs before cell death.
ADR1-L1-TagRFP was co-expressed with DEX::SUMM2 ac -HA in N.
benthamiana .
Two days post-infiltration, SUMM2 ac was induced by 50 μM DEX treatment, and the RFP signal was observed with confocal laser scanning microscopy at the indicated time shown as maximum projections from 18 images with a z-step of 1 µm (top panel).
Scale bar, 25 μm.
Cell death was documented over time under UV light (bottom panel).
h , The number and size of ADR1-L1-TagRFP puncta increase progressively over time.
The diameter (Ø) of ADR1-L1-TagRFP puncta from ( g ) was measured at the indicated time points in an area of 400 μm 2 using ImageJ and divided into groups of ≤ 0.4 μm and > 0.4 μm.
Data are presented as mean ± SEM ( n = 30).
i , Active SUMM2 does not alter the PM localization pattern of BRI1.
BRI1-GFP and ADR1-L1-TagRFP were co-expressed with DEX::SUMM2 ac -HA in N.
benthamiana .
Two days post-infiltration, SUMM2 ac was induced by 50 μM DEX, and the images were taken from the same cell right before (-, top) or 4 hr after DEX treatment (SUMM2 ac , bottom) using a confocal laser scanning microscopy.
The left panel shows single-plane images, and the right panel shows maximum projections from 16 images with a z-step of 1 µm.
Scale bar, 25 μm.
j , ADR1-L1-TagRFP puncta are observed in the mekk1 mutant.
Leaves of two-week-old soil-grown transgenic lines of 35S::gADR1-L1-TagRFP in WT or mekk1 were imaged using a confocal laser scanning microscope (scale bar, 10 μm, bottom panel) with the plant phenotypes shown (top panel).
k , RNAi- MEKK1 -induced ADR1-L1-GFP puncta clusters depend on EDS1 and PAD4 in Arabidopsis .
Two-week-old transgenic lines expressing pADR1-L1::gADR1-L1-GFP in the eds1-2 , pad4-1 , or WT background were inoculated with Agrobacterium carrying RNAi- MEKK1 .
After two weeks, leaf samples were imaged using a Leica TCS SP8 laser scanning confocal microscope (top) or a Leica DMi8 Infinity TIRF microscope (bottom).
ADR1-L1-GFP puncta or puncta clusters were observed in WT but not in eds1-2 or pad4-1 , as indicated by arrowheads or dotted lines.
For each genotype, ten independent fields of view were examined, with similar distribution patterns were observed.
Scale bar, 10 μm (top) and 1 μm (bottom).
l , Expression of HopAI1 induces ADR1-L1-GFP punctate signals at the cell periphery.
Leaves from four-week-old WT Arabidopsis plants were hand-inoculated with Agrobacteria containing pADR1-L1::gADR1-L1-GFP with or without (-) DEX::HopAI1-HA at OD 600 = 2.0.
Two days post Agrobacterium infiltration, 50 μM DEX was treated.
Fluorescence signals were examined at six days post-infiltration using a confocal laser scanning microscope.
Scale bar, 10 μm.
In immunoblot ( d ), RBCs were run on the same gels and used as loading controls.
Statistical analysis was performed using a two-tailed Student’s t -test ( h ).
Experiments were repeated three times with similar results.
For gel source data, see Supplementary Fig.
1 .
Extended Data Fig.
10 The active SUMM2 induces the formation of ADR1-L1 resistosome clusters.
a-e , SUMM2-GFP subcellular dynamics with and without activation.
a , TIRF microscopy images (exposure time: 95 ms) of Arabidopsis epidermal cells expressing pSUMM2::SUMM2-GFP , two weeks after VIGS with a vector control (Ctrl) or MEKK1 .
Bottom panels show kymographs derived from time-lapse TIRF imaging over 10 sec (acquisition rate: 8 frames per sec), illustrating comparable lateral mobility of SUMM2-GFP in Ctrl and RNAi- MEKK1 conditions.
Scale bar, 5 µm.
b , Representative single-particle trajectories reconstructed from TIRF image sequences (8 frames per sec) show comparable diffusion behavior of SUMM2-GFP in Ctrl and RNAi- MEKK1 conditions.
Scale bar, 5 μm.
c , Distribution of diffusion coefficients (D) represented as log (D) reveals similar distributions of SUMM2-GFP mobility under both conditions.
d , Quantification of peak D values (log-transformed) from normal distribution fits of individual cells.
Data represent mean ± SEM with each dot representing a single cell.
Total sample sizes were: RNAi-Ctrl ( n = 21), RNAi- MEKK1 ( n = 23).
No significant difference was observed between Ctrl and RNAi- MEKK1 conditions.
e , Mean square displacement (MSD) analysis over time for all tracked SUMM2-GFP particle trajectories, showing comparable diffusion behavior between Ctrl and RNAi- MEKK1 conditions.
Data represent mean ± SEM from pooled trajectories.
f-j , SUMM2-GFP and SUMM2 ac -GFP exhibit similar mobility dynamics at the plasma membrane.
f , TIRF microscopy images (exposure time: 95 ms) of Arabidopsis epidermal cells expressing DEX::SUMM2-GFP or DEX::SUMM2 ac -GFP .
Transgenic plants were treated with 50 μM DEX and imaged 3 days post-treatment.
Bottom panels show kymographs derived from time-lapse TIRF imaging over 10 s (acquisition rate: 8 frames per sec), illustrating comparable lateral mobility of SUMM2-GFP and SUMM2 ac -GFP particles at the plasma membrane.
Scale bar, 5 µm.
g , Representative single-particle trajectories of SUMM2-GFP and SUMM2 ac -GFP molecules reconstructed from TIRF time-lapse recordings (acquisition rate: 8 frames per second).
Scale bar, 5 µm.
h , Probability distribution of diffusion coefficients (D), plotted as log (D), shows similar profiles for SUMM2-GFP and SUMM2 ac -GFP particles.
i , Quantification of peak D values (log-transformed) from normal distribution fits of individual cells.
Data represent mean ± SEM with each dot representing a single cell.
Total sample sizes were: SUMM2-GFP ( n = 18); SUMM2 ac -GFP ( n = 18).
No significant difference was observed between SUMM2-GFP and SUMM2 ac -GFP.
j , MSD analysis over time of all tracked particle trajectories, showing comparable diffusion behavior between SUMM2-GFP and SUMM2 ac -GFP.
Data represent mean ± SEM from pooled trajectories.
k , Comparison of ADR1-L1 puncta under the TIRF microscope (top panel) and confocal microscope (bottom panel).
Scale bar, 1 μm.
l , SUMM2 ac stimulates the progressive assembly of ADR1-L1-TagRFP resistosome clusters under the TIRF microscope.
ADR1-L1-TagRFP was co-expressed with a vector (-) or DEX::SUMM2 ac -HA in N.
benthamiana .
Two days post-infiltration, SUMM2 ac was induced by 50 μM DEX treatment for 4 or 6 hr, and the images were taken using TIRF microscopy (see also Fig.
3c ).
Scale bar, 5 μm.
m , 3D projections of the SUMM2 ac -induced ADR1-L1-TagRFP puncta were visualized using a depth color code.
Scale bar, 5μm.
3D projections were created from 12 images acquired with a z-step of 0.05 µm using the LAS X software and color-coded according to depth to highlight the vertical distribution of the structures.
Insets denote the regions zoomed in on the bottom panel.
n , Quadrat count analysis used to assess the spatial randomness of ADR1-L1-TagRFP particle distributions.
Schematic illustrating the quadrat-based spatial analysis applied to TIRF-derived particle coordinates shown in Fig.
3j .
The region of interest (ROI) was divided into a 9 × 8 grid of equal-area quadrats.
The number of ADR1-L1-TagRFP particles (depicted as circles) within each quadrat was counted.
The resulting observed frequency distribution was compared to a Poisson distribution expected under complete spatial randomness (CSR) using a chi-squared ( χ ²) goodness-of-fit test.
Distributions were classified as significantly clustered when p < 0.05 and consistent with randomness when p > 0.05.
o , Avrblb2/Rpi-blb2 induces Sl NRC3-GFP puncta formation and resistosome clusters in the PM.
Sl NRC3-GFP was co-expressed with Rpi-blb2 or Avrblb2 and Rpi-blb2 in N.
benthamiana nrc2/3/4 leaves.
Confocal images were taken two days after Agrobacterium infiltration.
Scale bar, 10 μm (top).
TIRF images were taken three days post-infiltration using a Leica DMi8 Infinity microscope.
Scale bar, 5 μm (bottom).
Upon Avrblb2 recognition, Sl NRC3-GFP transitions from a diffuse localization to form immobile punctate clusters.
p , EDS1-PAD4 complex localizes in the nucleus and cytoplasm.
EDS1-nYFP and PAD4-cYFP were co-expressed in N.
benthamiana for two days by Agrobacterium infiltration, and the YFP signals were detected using a confocal laser scanning microscope.
Scale bar, 25 μm.
Experiments were repeated three times with similar results.
Supplementary Information (download PDF )
Supplementary Figure 1.
Uncropped immunoblots from Figures.
Supplementary Table 1.
List of all the primers used in the study
Reporting Summary (download PDF )
Peer Review file (download PDF )
Supplementary Video 1 (download MP4 )
SUMM2 ac leads to the formation of a discontinuous pattern of ADR1-L1 puncta along the cell periphery .
The video shows a 3D projection from 32 confocal images with a z-step of 1 µm, taken from N.
benthamiana leaves co-expressing ADR1-L1-nYFP and ADR1-L1-cYFP with DEX::SUMM2 ac -HA, treated with 50 μM DEX for 6 hr after two days post Agrobacterium infiltration.
The 3D projection was created using Leica LAS X software.
Scale bar, 20 μm
Supplementary Video 2 (download MP4 )
ADR1-L1 is uniformly distributed in the PM as highly mobile and small foci in the steady state .
Time-lapse images were acquired via TIRF microscopy at a 60 ms interval.
The video playback rate is 8 fps.
Images were taken from N.
benthamiana leaves co-expressing ADR1-L1-TagRFP with vector control (-), treated with 50 μM DEX for 6 hr after two days post Agrobacterium infiltration.
Scale bar, 5 μm
Supplementary Video 3 (download ZIP )
a.
Single-particle trajectories of steady-state ADR1-L1-TagRFP .
Representative single-particle trajectories of steady state ADR1-L1-TagRFP in N.
benthamiana epidermal cells imaged by TIRF microscopy (exposure time, 95 ms; 8 frames per second).
b.
Single-particle trajectories of activated ADR1-L1-TagRFP .
Representative single-particle trajectories of SUMM2 ac -activated ADR1-L1-TagRFP in N.
benthamiana epidermal cells imaged by TIRF microscopy (exposure time, 95 ms; 8 frames per second).
Induction of SUMM2 ac (DEX treatment for 6 hr) restricts ADR1-L1-TagRFP mobility.
Scale bar, 5 µm
Supplementary Video 4 (download ZIP )
a.
Single-particle trajectories of SUMM2-GFP .
Representative single-particle trajectories of SUMM2-GFP in pSUMM2::SUMM2-GFP transgenic plants without silencing MEKK1 , reconstructed from TIRF image sequences (8 frames per second).
Scale bar, 5 μm.
b.
Single-particle trajectories of SUMM2-GFP upon activation .
Representative single-particle trajectories of SUMM2-GFP in pSUMM2::SUMM2-GFP transgenic plants upon silencing MEKK1 , reconstructed from TIRF image sequences (8 frames per second).
Scale bar, 5 μm
Supplementary Video 5 (download ZIP )
a.
Single-particle trajectories of SUMM2-GFP .
Representative single-particle trajectories of SUMM2-GFP reconstructed from TIRF time-lapse recordings (8 frames per second).
Scale bar, 5 µm.
b.
Single-particle trajectories of SUMM2 ac -GFP .
Representative single-particle trajectories of SUMM2 ac -GFP reconstructed from TIRF time-lapse recordings (8 frames per second).
Scale bar, 5 µm
Supplementary Video 6 (download MP4 )
TIRF microscopy reveals that the SUMM2 ac -induced ADR1-L1 puncta observed under the confocal microscopy correspond to a cluster of immobile spots .
Time-lapse images were acquired via TIRF microscopy at a 60 ms interval.
The video playback rate is 8 fps.
Images were taken from N.
benthamiana leaves co-expressing ADR1-L1-TagRFP and DEX::SUMM2 ac , treated with 50 μM DEX for 6 hr after two days post Agrobacterium infiltration.
Scale bar, 5 μm.
Supplementary Video 7 (download MP4 )
SUMM2 ac -induced ADR1-L1 immobile spots are the result of the fusion of ADR1-L1 molecules .
Time-lapse images were acquired via TIRF microscopy at a 120 ms interval.
The video playback rate is 3.5 fps.
Images were taken from N.
benthamiana leaves co-expressing ADR1-L1-TagRFP and DEX::SUMM2 ac , treated with 50 μM DEX for 6 hr after two days post Agrobacterium infiltration.
Scale bar, 1 μm.
Supplementary Video 8 (download MP4 )
A model of ADR1-L1 resistosome cluster formation in the presence of SUMM2 ac .
In the steady state, ADR1-L1 molecules are uniformly distributed in the PM.
Upon SUMM2 ac activation, ADR1-L1 molecules begin to oligomerize, forming resistosomes that arrange into a ring-like cluster.
Supplementary Video 9 (download ZIP )
a.
EDS1-PAD4 is in a highly dynamic diffuse state under non-induced conditions .
Time-lapse images were acquired via TIRF microscopy at a 120-ms interval.
The video playback rate is 8 fps.
Images were taken from N.
benthamiana leaves co-expressing EDS1-nYFP and PAD4-cYFP without DEX::SUMM2 ac , treated with 50 μM DEX for 6 hr after two days post Agrobacterium infiltration.
Scale bar, 5 μm.
b.
EDS1-PAD4 transitions to highly organized assemblies upon SUMM2 ac activation .
Time-lapse images were acquired via TIRF microscopy at a 120-ms interval.
The video playback rate is 8 fps.
Images were taken from N.
benthamiana leaves co-expressing EDS1-nYFP and PAD4-cYFP with DEX::SUMM2 ac , treated with 50 μM DEX for 6 hr after two days post Agrobacterium infiltration.
Scale bar, 5 μm
Source Data Figs.
1, 2, 3, 4 and Source Data Extended Data Figs.
3, 4, 5, 6, 7, 8, 9, 10 (download XLSX )
Ge, D., Ortiz-Morea, F.A., Xie, Y.
et al.
Assembly of helper NLR resistosome clusters upon activation of a coiled-coil NLR.
Nature (2026).
https://doi.org/10.1038/s41586-026-10215-1
Version of record : 11 March 2026
DOI : https://doi.org/10.1038/s41586-026-10215-1
Related Stories


Source: This article was originally published by Nature News
Read Full Original Article →
Comments (0)
No comments yet. Be the first to comment!
Leave a Comment