Nature ( 2026 ) Cite this article
Supratentorial ependymomas are aggressive childhood brain cancers that retain features of neurodevelopmental cell types 1 and segregate into molecularly and clinically distinct subgroups 2 , 3 , suggesting different developmental roots.
The developmental signatures, as well as microenvironmental factors, underlying aberrant cellular transformation and behaviour across each supratentorial ependymoma subgroup are unclear.
Here we integrated single-cell and spatial transcriptomics, as well as in vitro and in vivo live-cell imaging, to define supratentorial ependymoma cell states, spatial organization and dynamic behaviour within the neural microenvironment.
We find that individual tumour subgroups have two distinct progenitor-like cell states—neuroepithelial-like and embryonic-like—that are reminiscent of early human brain development and diverge in the extent of their neuronal or ependymal differentiation.
We further identify several modes of spatial organization of these tumours, including a high-order architecture that is influenced by mesenchymal and hypoxia signatures, and local neighbourhood structures.
Finally, we identify a role for brain-resident cells in shifting supratentorial ependymoma cellular heterogeneity towards neuronal-like cells that co-opt immature neuronal morphology and migratory mechanisms, and a subset of neuroepithelial-like cells that are both proliferative and highly migratory.
Collectively, these findings provide a multidimensional framework to integrate transcriptional and phenotypic characterization of tumour heterogeneity in supratentorial ependymoma and its potential clinical implications.
NeuroDepth: an ultra long whole brain reachable multi-channel probe for real-time precise functional localization of deep human brain tumor margins
Interrogation of the microenvironmental landscape in spinal ependymomas reveals dual functions of tumor-associated macrophages
The biology of ependymomas and emerging novel therapies
Brain cancers are the leading cause of cancer-related deaths in children and adolescents, surpassing leukaemia 4 .
Deciphering the developmental correlates is pivotal to therapeutic advancement as malignant cells retain molecular and phenotypic properties of their progenitor origins 5 , 6 , 7 .
Supratentorial ependymomas (ST-EPNs) are brain tumours that occur in the central nervous system, with varied outcomes and limited available therapies 8 , 9 , 10 .
Recent genome-wide DNA methylation profiling studies have classified ST-EPNs into multiple subgroups with distinct fusion genes and patient outcomes 2 , 3 .
These include the canonical ST-ZFTA subgroup, characterized by the fusion of NF-κB pathway regulator RELA with the zinc-finger-translocation-associated ZFTA ( ZFTA-RELA ), and the non-canonical ST-ZFTA subgroups ( ZFTA clusters 1 to 4), which have ZFTA-RELA fusions or fusions between ZFTA and other partner genes.
Furthermore, the ST-YAP1 subgroup is enriched for fusions of Hippo effector YAP1 .
It remains unclear whether these subgroups have distinct cellular origins and composition of malignant cell states, contributing to differences in outcomes and varying resistance to therapy.
To address these questions, previous studies have used single-cell (scRNA-seq) and single-nucleus (snRNA-seq) RNA sequencing 1 , 11 to characterize the molecular cell states of ST-EPN tumours based on distinct gene expression profiles.
However, these studies did not include the non-canonical ST-ZFTA subgroups, which led to many cell states being sample- or subgroup-specific.
These limitations highlight the need for a comprehensive study examining the composition of malignant cell states of tumours across all subgroups of ST-EPNs.
In addition to the cell-intrinsic properties, it has become clear how cancer cell diversity is further influenced by their microenvironment, where interactions with adjacent cells and non-genetic factors augment cellular variability and malignant phenotypes 12 .
Recent advances in spatial transcriptomics have overcome the loss of spatial information in scRNA-seq analyses, thereby revealing the intricate ecosystem within various tumours 13 , 14 .
Moreover, live-cell imaging has proven to be effective for capturing the dynamic nature of tumour cells within their microenvironment while preserving cell viability, morphology and function 15 .
Such multilayered analyses linking cell state to microenvironmental influences, dynamic morphology and behaviour of malignant cells have yet to be carried out in ST-EPN tumours.
Here we integrate sc/snRNA-seq, spatial transcriptomics, and in vitro and in vivo live-cell imaging to provide a multidimensional framework to characterize tumour heterogeneity in ST-EPNs.
Taken together, we identify the extensive tumour heterogeneity in ST-EPNs by shedding light on their developmental cell states, patterns of spatial localization, and cellular morphology and behaviour, thereby opening potential avenues for therapeutic interventions.
Transcriptionally distinct ST-EPN subgroups
Fig.
1: Molecular signatures of ST-EPN subgroups differentially project to human cortical development.
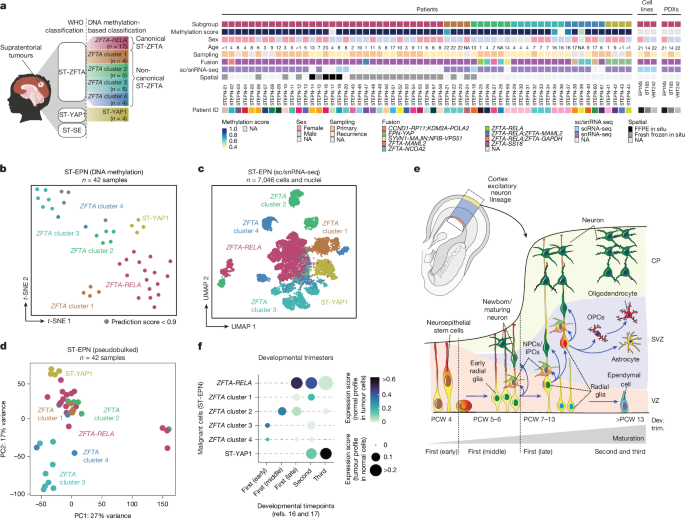
a , Oncoplot depicting the ST-EPN samples profiled in this study.
FFPE, formalin-fixed paraffin-embedded; NA, not applicable or information not available; WHO, World Health Organization.
b , t -Distributed stochastic neighbour embedding ( t -SNE) plot of the ST-EPN samples profiled for DNA methylation and coloured by molecular subgroup.
Samples with a methylation prediction score <0.9 are indicated in grey.
c , Uniform manifold approximation and projection (UMAP) plot of malignant ST-EPN cells profiled by sc/snRNA-seq and coloured by the molecular subgroup.
d , Principal component (PC) analysis plot of 3,000 highly variable genes across samples; each dot is a sample coloured by molecular subgroup.
e , Simplified schematic of cell types present during human cortical development 16 , 17 .
CP, cortical plate; Dev.
trim.; developmental trimester; IPCs, intermediate progenitor cells; NPCs, neural progenitor cells; OPCs, oligodendrocyte precursor cells; PCW, post-conception week; SVZ, subventricular zone; VZ, ventricular zone.
Bottom, cell types ( y axis) present during the first, second and third trimester of human cortical development ( x axis).
f , Projections of ST-EPN subgroups ( y axis) onto developmental timepoints found across the developing human cortex ( x axis).
First (early), PCW 4; first (middle), PCW 5–6; first (late), PCW 7–13; second, PCW 14–27; third, PCW 28–37.
The diagram in a was created using BioRender; Jeong, D.
https://BioRender.com/mqaz6z0 (2026).
Full size image
a , Oncoplot depicting the ST-EPN samples profiled in this study.
FFPE, formalin-fixed paraffin-embedded; NA, not applicable or information not available; WHO, World Health Organization.
b , t -Distributed stochastic neighbour embedding ( t -SNE) plot of the ST-EPN samples profiled for DNA methylation and coloured by molecular subgroup.
Samples with a methylation prediction score <0.9 are indicated in grey.
c , Uniform manifold approximation and projection (UMAP) plot of malignant ST-EPN cells profiled by sc/snRNA-seq and coloured by the molecular subgroup.
d , Principal component (PC) analysis plot of 3,000 highly variable genes across samples; each dot is a sample coloured by molecular subgroup.
e , Simplified schematic of cell types present during human cortical development 16 , 17 .
CP, cortical plate; Dev.
trim.; developmental trimester; IPCs, intermediate progenitor cells; NPCs, neural progenitor cells; OPCs, oligodendrocyte precursor cells; PCW, post-conception week; SVZ, subventricular zone; VZ, ventricular zone.
Bottom, cell types ( y axis) present during the first, second and third trimester of human cortical development ( x axis).
f , Projections of ST-EPN subgroups ( y axis) onto developmental timepoints found across the developing human cortex ( x axis).
First (early), PCW 4; first (middle), PCW 5–6; first (late), PCW 7–13; second, PCW 14–27; third, PCW 28–37.
The diagram in a was created using BioRender; Jeong, D.
https://BioRender.com/mqaz6z0 (2026).
As DNA methylation profiles used to categorize these tumours cluster subgroups differently (Fig.
1b ) and are considered epigenetic fingerprints of cellular origins in both development and tumorigenesis 18 , 19 , we hypothesized that ST-EPN tumours would correspondingly be transcriptionally distinct.
Accordingly, we found that the malignant cells cluster both by sample and by molecular subgroup classification (Fig.
1c and Extended Data Fig.
1e ), consistent with previous observations 3 .
We further derived the top 3,000 highly variable genes across samples and performed principal component analysis to demonstrate that samples cluster by their molecular subgroup classification (Fig.
1d ).
We next examined whether the intertumoural differences observed across subgroups reflect different developmental origins and compared the transcriptomic profiles of malignant cells with normal tissues’ transcriptomes.
We first assembled a single-cell reference atlas of the developing human cerebral cortex from two published scRNA-seq datasets 16 , 17 (Fig.
1e and Extended Data Fig.
1f,g ) that includes all three prenatal trimesters of human cortical development from post-conception week 4 to 37 (Supplementary Tables 2 and 3 ).
We next projected gene expression profiles of non-malignant cells from the reference atlas 16 , 17 onto individual ST-EPN cells (Fig.
1f and Extended Data Fig.
2a ).
While ZFTA cluster 3 and ZFTA cluster 4 tumours projected to the earliest time window of the early and middle first trimesters, ZFTA cluster 2 and ZFTA cluster 1 tumours mapped onto the later windows of middle first and second trimesters.
Finally, canonical ZFTA-RELA tumours projected broadly from the late first to second and third trimester, while ST-YAP1 aligned with the latest timepoints (Fig.
1f and Extended Data Fig.
2a ).
Overall, the correlation of ST-EPN subgroups with different developmental stages suggests divergent developmental patterns across subgroups.
In summary, our analyses reveal that molecularly distinct ST-EPN subgroups are transcriptionally distinct and align to distinct developmental timepoints across human cortical development.
Cell states mirror early human cortex
To identify specific cell states across ST-EPN tumour subgroups, we next moved from pseudobulk projections to comparing single-cell gene expression profiles identified in each sample by non-negative matrix factorization (NMF) 20 .
This analysis revealed eight clusters of recurrent programs across ST-EPN tumours (Fig.
2a ), termed metaprograms, that reflect cellular states.
We annotated each metaprogram based on the expression of known cell-type-specific marker genes (Supplementary Table 4 ), projection onto developing human cerebral cortex reference atlases (Extended Data Fig.
2b ) and functional analysis using Gene Ontology (GO) enrichment analysis (Extended Data Fig.
2c and Supplementary Table 5 ).
Fig.
2: Intratumoural heterogeneity of ST-EPN tumours.
a , The Pearson correlation coefficient between individual NMF programs identified within each ST-EPN sample profiled by snRNA-seq.
Programs are grouped into eight recurrent metaprograms (dashed lines).
MES, mesenchymal.
b , The relative expression ( z score) of the top 30 genes for each metaprogram across all ST-EPN cells profiled in this study.
Selected genes are highlighted.
c , UMAP plot of malignant ST-EPN cells coloured by identified cellular state.
d , The proportion of cellular states ( y axis) in each ST-EPN sample ( x axis).
Sample properties are displayed in the bottom row.
e , Cell state plot of malignant ST-EPN cells.
Cells were scored for the metaprograms identified by NMF analysis (top 30 genes) and coloured by molecular subgroup.
Full size image
a , The Pearson correlation coefficient between individual NMF programs identified within each ST-EPN sample profiled by snRNA-seq.
Programs are grouped into eight recurrent metaprograms (dashed lines).
MES, mesenchymal.
b , The relative expression ( z score) of the top 30 genes for each metaprogram across all ST-EPN cells profiled in this study.
Selected genes are highlighted.
c , UMAP plot of malignant ST-EPN cells coloured by identified cellular state.
d , The proportion of cellular states ( y axis) in each ST-EPN sample ( x axis).
Sample properties are displayed in the bottom row.
e , Cell state plot of malignant ST-EPN cells.
Cells were scored for the metaprograms identified by NMF analysis (top 30 genes) and coloured by molecular subgroup.
Two metaprograms were associated with generic cancer cell processes, including a cycling metaprogram ( HELLS , CENPF ) 21 , 22 that is enriched in genes associated with cell proliferation, and a mesenchymal/hypoxia ( PGK1 , ENO1 , CD44 ) 23 , 24 metaprogram that highly expresses hypoxia-related genes (Fig.
2b and Supplementary Table 4 ).
The remaining six metaprograms were distinctly related to developmental programs, including (1) an embryonic-like metaprogram ( ALDH1A2 , CTBP2 , ACTN4 ), which expresses genes that are essential for the formation and patterning of the embryo 23 , 25 , 26 and is enriched in GO terms related to retinoic acid receptor signalling, not matching to a particular cell type found in the developing human brain; (2) an neuroepithelial-like metaprogram ( TUBA1A , ACTG1 ) 27 , 28 , which strongly projects to neuroepithelial stem cells of the developing human cortex; (3) a radial glial-like metaprogram that expresses radial glial genes ( LRIG1 , DCLK1 ) 29 , 30 ; (4) an embryonic-neuronal-like metaprogram ( RBFOX1, CNTNAP2 ) that is enriched with immature neuronal genes 31 , 32 ; (5) a neuronal-like metaprogram ( KIRREL3 , NRXN3 ) that is enriched in neuronal-differentiation-related genes 33 , 34 ; and (6) an ependymal-like metaprogram ( DNAH9 , DNAH6 ) that is enriched with cilia-related genes 35 (Fig.
2b , Extended Data Fig.
2b,c and Supplementary Tables 4 and 5 ).
These metaprograms partially correlated with those identified in posterior fossa, spinal and supratentorial ependymomas of previous studies 14 (Extended Data Fig.
2d ).
We further examined the proliferative capacity of each metaprogram and found that the most progenitor-like populations, namely neuroepithelial-like and embryonic-like cells, were the most proliferative, whereas radial glial-like and ependymal-like were the least proliferative (Extended Data Fig.
2e,f ).
Identification of differentially expressed genes between the two progenitor-like populations revealed that, while neuroepithelial-like cells were enriched in genes associated with GO terms related to central nervous system development and neural differentiation (Extended Data Fig.
2g–i ), embryonic-like cells were enriched in genes associated with early embryonic developmental processes, including somite development (Extended Data Fig.
2g–i ).
We next examined how the proportion of the identified metaprograms differs across ST-EPN subgroup.
While ZFTA-RELA tumours were composed predominantly of neuroepithelial-like, neuronal-like and ependymal-like cells, neuronal-like cells were few or absent in ZFTA cluster 1, ZFTA cluster 3 and ST-YAP1 tumours (Fig.
2d and Extended Data Fig.
3a ).
Conversely, ZFTA cluster 2, 3 and 4 tumours had a lower frequency of ependymal-like cells.
Moreover, ZFTA cluster 3 tumours displayed a distinct intratumoural composition, being mostly composed of embryonic-like and embryonic-neuronal-like subpopulations (Fig.
2d and Extended Data Fig.
3a ).
This is consistent with the undifferentiated histology of ZFTA cluster 3 tumours, previously often diagnosed as sarcoma, central nervous system embryonal or other primitive tumours 3 .
To summarize the distribution of metaprograms in each ST-EPN subgroup, we scored all single cells for the two most proliferative and immature (neuroepithelial-like and embryonic-like) and the two more mature (neuronal-like and ependymal-like) lineage-related expression programs and visualized the results as a cell-state plot (Fig.
2e ).
We found that the two immature cell states existed in a mutually exclusive manner, indicating that, when neuroepithelial-like cells were present in ZFTA-RELA and ZFTA clusters 1, 2 and 4, there were no embryonic-like cells present.
Conversely, in ZFTA cluster 3, in which embryonic-like cells were highly present, neuroepithelial-like cells were much less abundant.
This probably indicates two distinct developmental signatures of ST-EPN tumours, with ZFTA cluster 3 especially as a distinct entity from the other subgroups.
Notably, despite the different cellular state composition, both ZFTA-RELA and ZFTA cluster 3 have the same ZFTA-RELA fusions (Fig.
1a ).
Differential gene expression analysis between ZFTA-RELA and ZFTA cluster 3 (Extended Data Fig.
3b–d ) identified early development and morphogenic-related gene signatures enriched in ZFTA cluster 3, consistent with the higher proportion of embryonic-like cells in these tumours.
Moreover, tumours from different subgroups were distinct in the lineages in which they represent.
While there was a continuum of gene expression to both neuronal and ependymal-like cells in ZFTA-RELA tumours, the other ST-EPN subgroups showed unique cell state signatures, with ZFTA clusters 1–3 having only one mature cell state and ZFTA cluster 4 appearing to remain in a premature cell state (Fig.
2e ).
Moreover, ST-YAP1 tumours mainly exhibited ependymal-like signatures, with very few progenitor cells present.
We validated these findings using an external patient cohort 2 and confirmed that patient ST-YAP1 tumours map onto ependymal-like signatures, whereas patient ZFTA-RELA tumours map onto both neuronal-like and ependymal-like signatures (Extended Data Fig.
3e–g ).
Overall, our findings suggest that ST-EPN tumours from different molecular subgroups have distinct developmental signatures, with variability in neuronal and ependymal lineages.
We highlight ZFTA cluster 3 and ST-YAP1 especially as distinct entities in progenitor and lineage transcriptional profiles.
Spatial mapping of ZFTA-RELA cell states
We next investigated how these identified tumour cell states are spatially organized in the tissue, and whether recurrent spatial patterns of localization exist across tumours.
To do so, we performed 10x Genomics Xenium in situ transcriptomics on a total of 56 tumour sections from 23 patients with ZFTA-RELA to enable subcellular-resolution mapping of 358 target genes (Supplementary Table 6 ).
We focused on tumours of the canonical ZFTA-RELA subgroup as they encompass the majority of ST-EPNs 2 .
We used a combination of a custom-based gene panel curated from our scRNA-seq dataset, containing marker genes of identified tumour subpopulations, and fusion-specific probes to detect ZFTA-RELA fusion type 1, 2 and 3 transcripts, combined with a human brain gene panel containing normal cell-type-specific genes (Fig.
3a ).
Fig.
3: Global spatial architecture of ZFTA-RELA tumours.
a , Schematic of the 10x Xenium in situ workflow.
b , Illustration of the metaprogram annotation (left) and calculation of the spatial coherence score (right) of a representative ZFTA-RELA sample (STEPN-19).
Two regions within the sample with high and low spatial coherence scores are shown.
c , The proportion of tumour cell states and non-malignant cell types ( y axis) in patient ZFTA-RELA tumours profiled by 10x Xenium ( x axis) (top).
For patients with multiple tumour sections analysed, the average proportion is shown.
Samples are ordered by increasing spatial coherence score.
Bottom, spatial maps of two sections, demonstrating differences in spatial organization between disorganized (STEPN-54) and structured (STEPN-19) tumours.
d , Correlation between the spatial coherence score and the logit-transformed proportion of mesenchymal/hypoxia cells (top) or embryonic-neuronal-like cells (bottom) in ZFTA-RELA tumour samples profiled by 10x Xenium.
Datapoints (representing mean values across tumour sections per sample) are interpolated with simple linear regression.
The goodness of fit ( R , R 2 ), Bonferroni-corrected P values and the total number of tumour samples ( n ) are displayed at the top.
The grey-shaded band denotes the 95% confidence interval for the mean fitted response at each x value.
The diagram in a was created using BioRender; Jeong, D.
https://BioRender.com/72agz2l (2026).
Full size image
a , Schematic of the 10x Xenium in situ workflow.
b , Illustration of the metaprogram annotation (left) and calculation of the spatial coherence score (right) of a representative ZFTA-RELA sample (STEPN-19).
Two regions within the sample with high and low spatial coherence scores are shown.
c , The proportion of tumour cell states and non-malignant cell types ( y axis) in patient ZFTA-RELA tumours profiled by 10x Xenium ( x axis) (top).
For patients with multiple tumour sections analysed, the average proportion is shown.
Samples are ordered by increasing spatial coherence score.
Bottom, spatial maps of two sections, demonstrating differences in spatial organization between disorganized (STEPN-54) and structured (STEPN-19) tumours.
d , Correlation between the spatial coherence score and the logit-transformed proportion of mesenchymal/hypoxia cells (top) or embryonic-neuronal-like cells (bottom) in ZFTA-RELA tumour samples profiled by 10x Xenium.
Datapoints (representing mean values across tumour sections per sample) are interpolated with simple linear regression.
The goodness of fit ( R , R 2 ), Bonferroni-corrected P values and the total number of tumour samples ( n ) are displayed at the top.
The grey-shaded band denotes the 95% confidence interval for the mean fitted response at each x value.
The diagram in a was created using BioRender; Jeong, D.
https://BioRender.com/72agz2l (2026).
We first annotated each cell in situ by assessing the similarities between the top markers of the spatially identified Louvain clusters and previously defined tumour cell states and/or non-malignant cell type marker genes, as well as by label projection from our patient tumour sc/snRNA-seq dataset (Extended Data Fig.
4a ).
We detected on average 105,643 cells per tumour section and identified 12 spatial cell types and states including 5 non-malignant cell types and 7 malignant cell states (Fig.
3b,c and Extended Data Figs.
4 and 5 ).
Overall, the proportions of tumour cell states within samples were highly correlated with the proportions detected by sc/snRNA-seq ( R = 0.77, P = 0.003, Extended Data Fig.
4b ).
Moreover, we identified neurons that were absent in the sc/snRNA-seq analysis of patient tumours (Figs.
1a–c and 3c ).
Finally, we confirmed cell identity through expression of canonical marker genes (Extended Data Fig.
4a ) and malignant cell annotation based on higher expression of the fusion-specific ZFTA-RELA fusion probe (Extended Data Fig.
4c ).
Global spatial organization patterns
After annotating spatially distributed cell states, we observed that tumours segregated into two global organization patterns as also seen in glioblastoma 14 : (1) high compartmentalization of cell states, which we term structured tumours; and (2) cell states or types scattered throughout the section, which we term disorganized tumours (Fig.
3b,c ).
We quantified the degree of spatial organization of each tumour section by measuring the degree by which cells from the same state or type are surrounded by other cells of the same state or type, termed the spatial coherence score (Fig.
3b ).
Sections that appear structured will therefore have high spatial coherence scores; inversely, sections that appear disorganized will have low spatial coherence scores.
By applying our algorithm to 56 tumour sections, we successfully distinguished between tumour sections that were structured (for example, STEPN-19), and those that were disorganized (for example, STEPN-54; Fig.
3c and Extended Data Fig.
4d ).
We did not observe a statistically significant difference in the global structural organization between primary and recurrent tumours (data not shown).
To determine whether the presence of a particular tumour state or type correlates with spatial organization, we performed linear regression analyses between the spatial coherence score of each sample and the proportion of cells observed for each malignant cell state or non-malignant cell type (Fig.
4e and Extended Data Fig.
4e ).
This analysis revealed that higher spatial coherence scores were positively correlated with the logit-transformed proportion of mesenchymal/hypoxia cells ( R = 0.69, Bonferroni-corrected P = 0.00315, n = 23; Fig.
3d and Supplementary Table 7 ), while inversely correlated with the logit-transformed proportion of embryonic-neuronal-like cells ( R = −0.59, Bonferroni-corrected P = 0.0338, n = 23; Fig.
3d and Supplementary Table 7 ).
These findings were also corroborated by multiple linear regression analysis (Supplementary Table 7 ), suggesting that the presence of mesenchymal/hypoxia and embryonic-neuronal-like cell states is specifically associated with structured or disorganized tumours, respectively.
We next calculated the spatial coherence for each cell state or type to determine whether certain cell states or types are more likely to co-localize with themselves (Extended Data Fig.
4f ).
Mesenchymal/hypoxia cells showed high spatial coherence, suggesting that hypoxia correlates with global tumour spatial coherence, as well as co-localization of mesenchymal/hypoxia cells in distinct local neighbourhoods.
The inverse was observed for embryonic-neuronal-like cells, suggesting that these cells are more likely to be scattered throughout the tissue.
Overall, our results suggest that ZFTA-RELA tumours have distinct global spatial organization patterns, with more organization being highly correlated with the presence of mesenchymal/hypoxia cells, and more disorganization being correlated with embryonic-neuronal-like cells.
Local spatial organization patterns
Having analysed global spatial organization, we next sought to understand the proximal spatial relationships between all cell states and/or cell types by identifying groups of cells with similar neighbourhoods within tumours.
We first identified local spatial patterns, or spatial niches, within a tumour tissue individually, by clustering cells based on the proportion of cell states or types in their spatial proximity (Extended Data Fig.
6a ).
This analysis showed demarcated regions that were both transcriptionally and morphologically distinct, including spatial niches containing ependymal rosettes composed of ependymal cells (Extended Data Fig.
6a ), demonstrating the direct correlation between transcriptional cellular states and morphology.
We next aimed to identify recurrent local spatial patterns across multiple tumour sections by correlating spatial niches on the basis of the proportion of cell states or types present in each section (Extended Data Fig.
6b ).
Overall, we identified six recurrent niches, each enhanced in distinct malignant cell states or non-malignant cells (Extended Data Fig.
6b ).
Furthermore, we applied an orthogonal algorithmic framework called CellCharter 24 that simultaneously clusters local spatial patterns across all samples.
In brief, the method combines all cells and their features from multiple samples to perform dimensionality reduction.
Next, a network of cells is identified by their spatial proximity, after which clustering is performed using a Gaussian mixture model (GMM) (Fig.
4a ).
We determined n = 26 stable local spatial patterns, or spatial clusters, across 56 tumour sections (Extended Data Fig.
6c ) and identified 26 clusters at varying proportions in each section (Extended Data Fig.
6d ).
Moreover, we found that spatial clusters demarcated morphologically distinct regions in the tumour tissue: for example, regions with a high proportion of endothelial cells (Fig.
4b ).
We next subcategorized the 26 identified spatial clusters according to the cell state or type most abundantly represented within the cluster—a designation we refer to as enhanced.
Several clusters contained a high proportion of non-malignant cell types, including myeloid-enhanced (clusters 4 and 14), myeloid- and endothelial-enhanced (cluster 6) and endothelial-enhanced (cluster 18) regions (Fig.
4c ).
Other clusters exhibited a high proportion of specific malignant cell states, including mesenchymal/hypoxia-enhanced (clusters 22 and 13), neuronal-like-enhanced (clusters 24, 19, 1, 17 and 21) and the remaining spatial clusters, which were neuroepithelial-like enhanced (Fig.
4c ).
Moreover, these analyses corroborate findings from an analysis of recurrent spatial patterns by cell state or type proportions (Extended Data Fig.
6b,e,f ), in which myeloid and endothelial cells form distinct local spatial niches or clusters, and mesenchymal/hypoxia, neuronal-like and neuroepithelial-like cells preferentially form clusters with themselves (Fig.
4c and Extended Data Fig.
6b,e,f ).
Having characterized the diversity of tumour cell states in patient tumours, we next considered how interactions with the tumour microenvironment—particularly neurons and glial cells—influence their morphology and functional behaviour.
To do so, we first compared the heterogeneity of ZFTA-RELA patient-derived models to identify the extent to which each model recapitulates cell states present in the patient tumours.
We performed 10x scRNA-seq analysis of three patient-derived ZFTA-RELA cell models grown as adherent or spheroid monocultures, cocultured with rat E19 cortical cells or as PDXs, to characterize the transcriptional heterogeneity across various disease models (Extended Data Fig.
7a–d ).
We additionally characterized the rat E19 cortical cells used in cocultures as a mixture of neurons and glial cells (Extended Data Fig.
7e ).
ZFTA-RELA cells grown as a monoculture (adherent and spheroid) were prevalent in neuroepithelial-like cells (Extended Data Fig.
7b–d ), whereas ZFTA-RELA cells grown in coculture exhibited a greater abundance of neuronal-like cells (Extended Data Fig.
7a–d ) and neuronal-function-related GO terms (Extended Data Fig.
7f,g ), as well as some early ependymal-like signatures (Extended Data Fig.
7b–d ).
Finally, out of all of the models, cells grown in PDXs most closely recapitulated the cell states in patients, with both neuronal-like and ependymal-like signatures (Extended Data Fig.
7b–d ).
These findings overall suggest that brain-resident cells are required for plasticity of progenitor-like to more mature cell states.
Moreover, we identified PDX models and coculture systems with rat E19 cortical cells as models that most faithfully recapitulate tumour cell states.
Having observed distinct morphologies of cell states in these conditions, we assessed the morphological features of tumour cell states in coculture with rat E19 cortical cells and PDX models.
In both models, we observed tumour cells exhibiting immature neuron-like membrane protrusions resembling tumour microtubes (TMs) 15 , 36 , 37 , which could be classified into four distinct morphological subtypes (Fig.
5a ): cells without processes (0 TMs); cells with 1–3 short primary processes; cells with more than 3 short primary processes; and cells with 1–3 long primary processes (longer than 100 μm).
We next examined whether tumour cell morphologies reflect their transcriptomic cell states.
We therefore aimed at overlaying these morphologies with the molecular ZFTA-RELA cell state classification.
To do so, we selected markers from our patient sc/snRNA-seq dataset (Supplementary Table 4 and Extended Data Fig.
8a ) as well as known neurodevelopmental markers, and performed immunofluorescence staining together with high-resolution light microscopy (Fig.
5b and Extended Data Fig.
8b,c ).
Fig.
5: Morphomolecular classification of ZFTA-RELA cell populations.
a , Morphological characterizationof ZFTA-RELA cells (EP1NS) in in vivo PDX (top row) and in vitro coculture (bottom row) models.
ZFTA-RELA cells express endogenous tdTomato.
Blood vessels are shown in green.
Scale bars, 20 µm (top, left 3), 50 µm (top, far right), 25 µm (bottom, left 3), 100 µm (bottom, far right).
b , Representative immunofluorescence images and the mean signal intensity of in vitro coculture models of ZFTA-RELA cells, categorized by morphological cell subtypes.
Data are the mean intensity value of n = 155 cells acquired from n = 3 independent biological replicates per marker.
Scale bars, 20 µm.
c , Representative 10x Xenium images of each morphological cell subtype.
Each dot represents detected transcripts from the custom ( n = 100) and base panel ( n = 255) used for patient tumour sections.
The table shows the top two marker genes for each morphological cell subtype.
Scale bars, 20 µm.
d , The cell migration speed in the in vitro coculture model of ZFTA-RELA cells in µm h −1 ( n = 235 cells acquired from n = 3 independent biological replicates).
Data are mean ± s.e.m.
with individual datapoints.
P values were calculated using Dunn’s multiple-comparison test; not significant (NS), P = 0.286; ** P = 0.0046, *** P = 0.00058, **** P < 0.0001.
e , Representative neuronal-like ZFTA-RELA tumour cell showing saltatory migration in in vitro coculture.
Scale bars, 50 µm.
f , Quantification of migratory modes classified as neuroepithelial-like-2 ( n = 28) or neuronal-like ( n = 34).
g , Neuronal-like migratory patterns of ZFTA-RELA cells in vitro.
The arrows indicate the direction of TM movement.
The arrowheads point to the branching point (branching migration), cell soma (locomotion) or stable TM tip (translocation).
Scale bars, 100 µm (top), 50 µm (middle and bottom).
h , In vivo (PDX) time-lapse imaging of TM dynamics of ZFTA-RELA cells.
The arrowheads point to the ends of TMs.
Blood vessels are shown in green.
Scale bars, 20 µm.
i , The percentage of dividing ZFTA-RELA tumour cells in coculture categorized by their morphological cell state ( n = 83 neuroepithelial-like, n = 97 immature ependymal-like and n = 55 neuronal-like cells).
The diagram in a was created using BioRender; Jeong, D.
https://BioRender.com/7khydcm (2026).
Source data Full size image
a , Morphological characterizationof ZFTA-RELA cells (EP1NS) in in vivo PDX (top row) and in vitro coculture (bottom row) models.
ZFTA-RELA cells express endogenous tdTomato.
Blood vessels are shown in green.
Scale bars, 20 µm (top, left 3), 50 µm (top, far right), 25 µm (bottom, left 3), 100 µm (bottom, far right).
b , Representative immunofluorescence images and the mean signal intensity of in vitro coculture models of ZFTA-RELA cells, categorized by morphological cell subtypes.
Data are the mean intensity value of n = 155 cells acquired from n = 3 independent biological replicates per marker.
Scale bars, 20 µm.
c , Representative 10x Xenium images of each morphological cell subtype.
Each dot represents detected transcripts from the custom ( n = 100) and base panel ( n = 255) used for patient tumour sections.
The table shows the top two marker genes for each morphological cell subtype.
Scale bars, 20 µm.
d , The cell migration speed in the in vitro coculture model of ZFTA-RELA cells in µm h −1 ( n = 235 cells acquired from n = 3 independent biological replicates).
Data are mean ± s.e.m.
with individual datapoints.
P values were calculated using Dunn’s multiple-comparison test; not significant (NS), P = 0.286; ** P = 0.0046, *** P = 0.00058, **** P < 0.0001.
e , Representative neuronal-like ZFTA-RELA tumour cell showing saltatory migration in in vitro coculture.
Scale bars, 50 µm.
f , Quantification of migratory modes classified as neuroepithelial-like-2 ( n = 28) or neuronal-like ( n = 34).
g , Neuronal-like migratory patterns of ZFTA-RELA cells in vitro.
The arrows indicate the direction of TM movement.
The arrowheads point to the branching point (branching migration), cell soma (locomotion) or stable TM tip (translocation).
Scale bars, 100 µm (top), 50 µm (middle and bottom).
h , In vivo (PDX) time-lapse imaging of TM dynamics of ZFTA-RELA cells.
The arrowheads point to the ends of TMs.
Blood vessels are shown in green.
Scale bars, 20 µm.
i , The percentage of dividing ZFTA-RELA tumour cells in coculture categorized by their morphological cell state ( n = 83 neuroepithelial-like, n = 97 immature ependymal-like and n = 55 neuronal-like cells).
The diagram in a was created using BioRender; Jeong, D.
https://BioRender.com/7khydcm (2026).
We identified Nestin + S100B + neuroepithelial-like cells with no or 1–3 short TMs; CCDC40 + Nestin + S100B + immature ependymal-like cells, classified as cells with more than 3 short TMs; and DCX + Nestin + S100B + neuronal-like cells, classified as cells with 1–3 long TMs (Fig.
5b and Extended Data Fig.
8c ).
We confirmed our morphologies to cell state assignments by performing 10x Xenium analysis of ZFTA-RELA cells cocultured with rat E19 cortical cells to further identify the molecular features of each morphological subtype (Fig.
5c , Extended Data Fig.
9a and Supplementary Table 8 ).
Using this approach, we subclassified neuroepithelial-like cells into two groups: cells lacking TMs (neuroepithelial-like-1) and cells with 1–3 short TMs (neuroepithelial-like-2).
While both groups expressed cell cycling markers (neuroepithelial-like-1: ARL6IP1 , CENPF ; neuroepithelial-like-2: TUBA1A , PRDX1 ) (Fig.
5c and Supplementary Table 8 ), neuroepithelial-like-2 cells expressed additional development-associated markers such as NES and DCX (Fig.
5c and Extended Data Fig.
9a ).
Moreover, immature ependymal-like cells expressed progenitor markers including MAP3K19 , which is also highly expressed by tumour ependymal-like cells (Extended Data Fig.
8a ), and DNER .
As these cells are positive for CCDC40, a motile cilia-function-related protein specifically expressed in ependymal-like cells (Extended Data Fig.
8a ), we classified these cells as likely a more immature population of the ependymal-like cells found in patient tumours.
This finding also corroborates scRNA-seq results of tumour cells in coculture, in which we found a low mature ependymal-like signature (Extended Data Fig.
7b–d ).
Finally, neuronal-like cells expressed immature neuronal markers including TUBB3 and DCX .
Collectively, we overlayed molecularly defined ZFTA-RELA cellular states with distinct morphologies in both in vitro coculture models and in vivo.
Migratory patterns of cell states
Furthermore, we measured whether different cellular states have different proliferation rates.
Neuroepithelial-like-2 cells were the most proliferative compartment (Fig.
5i and Extended Data Fig.
9g ), which was consistent with our sc/snRNA-seq results (Extended Data Fig.
9h ) and with the expected behaviour of immature progenitor cells.
These findings overall suggest that neuroepithelial-like-2 cells are both highly migratory (Fig.
5d ) and highly proliferative (Fig.
5i ).
These complementary phenotypes could enable neuroepithelial-like-2 cells to have critical functions in tumour progression, driving both tumour expansion and migration to other brain regions.
Finally, to distinguish species-specific and cell-type differences in microenvironmental cues, we cocultured ZFTA-RELA cells with human induced pluripotent stem (iPS)-cell-derived excitatory neurons and astrocytes and performed 10x scRNA-seq and live-cell imaging (Extended Data Fig.
10 ).
The results were consistent with those from coculture with rat E19 cortical cells, highlighting that these phenotypes are conserved across rat and human microenvironmental contexts.
Taken together, these results suggest that ZFTA-RELA transcriptomic cellular states have distinct morphological and behavioural attributes in the context of their native neuroglial microenvironment.
We further confirm these patterns across species, underscoring the phenotypic heterogeneity of these cancer cell states influenced by the tumour microenvironment, which collectively contributes to tumour progression.
Our study identifies different malignant cell states as well as developmental signatures across molecular subgroups of ST-EPN tumours, including previously uncharacterized non-canonical ST-ZFTA tumours 3 .
Moreover, we demonstrate that individual cell states in ZFTA-RELA tumours have distinct spatial, morphological and behavioural characteristics.
We introduce a comprehensive dataset of tumours of patients with ST-EPN and highlight a clear discrepancy in both developmental signatures and differentiation lineages of different ST-EPN subgroups.
These distinct developmental signatures and perturbed lineage differentiation across subgroups lay the groundwork for developing much-needed personalized therapeutic strategies for these tumours.
Importantly, while clear differences in patient outcome have been described in comparisons between ZFTA-RELA with ST-YAP1 2 , 42 , and there are some case studies comparing ZFTA-RELA , ZFTA cluster 2 and ZFTA cluster 4 42 , 43 , there is an urgent need for a comprehensive clinical study comparing patient outcomes and therapeutic resistance across all defined molecular subgroups in ST-EPN tumours to further apply the findings from this study.
Building on our description of molecular cellular states across ST-EPN tumours, we also characterized how cellular states are spatially organized within ZFTA-RELA tumours.
We first highlight hypoxia as an element of global structural organization.
Notably, this has also been described in adult gliomas 14 , highlighting this as a potential common mechanism across brain tumours.
Despite hypoxia being described as critical for metabolism and epigenetic regulation in posterior fossa ependymomas 44 , its role in ST-EPNs has been underappreciated.
It would therefore be of interest for future studies to examine hypoxia-driven tissue structural changes and their functional implications directly in ST-EPN tumour models.
We also highlight an inverse relationship of embryonic-neuronal-like state to global spatial organization, raising questions regarding the extent of tumour microenvironment remodelling in the presence of this cell state and its therapeutic significance.
Furthermore, local tumour structures are predominantly enriched for certain malignant cellular states, also described as state-specific clustering in gliomas 14 .
This common phenomenon across brain tumours suggests that spatial location is a key regulator of cellular state.
We further integrate morphology and immunofluorescence with spatial transcriptomics and live-cell imaging to demonstrate the molecular and phenotypic distinction between tumour cellular states in the context of normal brain-resident cells.
We identify how the neural microenvironment allows for plasticity of ZFTA-RELA tumour cell states towards more mature neuronal trajectories across in vitro and in vivo models.
Moreover, we find that neuronal-like ZFTA-RELA cells in the presence of normal brain-resident cells display long TMs and adopt highly migratory behaviour, reminiscent of immature neurons during development.
These neuronal-like cells with neuronal morphology and behaviour have also been described in other types of gliomas 15 , highlighting a similar migratory tumour subpopulation in ST-EPN tumours.
This is notable, as ependymoma is thought to grow mostly locally at first and only show distant metastases at relapse, often increasing with the number of relapses 10 .
This warrants investigation into tumour material taken at the border of resection in patients to further examine the role of this tumour subpopulation in tumour invasion.
Furthermore, we identify a distinct population of cells, neuroepithelial-like-2, that possesses both migratory and proliferative capacities.
These distinct behaviours of cellular states highlight different forces promoting tumour malignancy, whereby neuronal-like cells may promote tumour migration while neuroepithelial-like-2 cells drive both functions.
This functional diversification within tumours has been modelled in various studies 45 , 46 and points to how transcriptional heterogeneity may lead to a collective facilitation of cancer progression in ST-EPN tumours.
In conclusion, integrating extensive transcriptomic, spatial, morphological and cellular behavioural characterization of patient tumours at the single-cell level identified signatures of ST-EPN tumours related to the mechanisms of migration, proliferation and plasticity.
This study provides a methodological framework to perform such multidimensional profiling to identify underlying biology across tumour types.
Experimental model and participant details
All of the deidentified samples used in this study were obtained after informed consent of patients and/or their legal representatives who did not receive compensation.
The study was approved by the institutional review board in agreement with local institutional ethics guidelines DFCI 10-417 (Boston Children’s Hospital and Dana-Farber Cancer Institute), S-531/2020 (Heidelberg University) and EK no.
1244/2016 (Medical University of Vienna).
Cohort characteristics are provided in Supplementary Table 1 .
EP1NS, BT165 and VBT242 cell lines were generated as previously described 47 , 48 and provided by collaboration partners.
Cells were grown in complete neurobasal medium, comprising Neurobasal-A Medium (Thermo Fisher Scientific, 10888022) supplemented with 1× of antibiotic–antimycotic 100× (Thermo Fisher Scientific, 15240062), 1× GlutaMAX (Thermo Fisher Scientific, 35050061), 1 mg ml −1 heparin solution (StemCell Technologies, 7980), 1× B-27 (Thermo Fisher Scientific, 12587010), 20 ng ml −1 recombinant human FGF-basic (Shenandoah Biotech, 100-146) and 20 ng ml −1 recombinant human EGF (Shenandoah Biotech, 100-26).
For further passaging, floating cells were centrifuged at 300 g for 5 min, dissociated with Accutase (Innovative Cell Technologies, AT104-500) for 5 min at 37 °C and washed with PBS (Gibco, 10010023).
All of the cell lines used were authenticated by single-nucleotide polymorphism analysis and cells were regularly tested for mycoplasma contamination.
EP1NS, BT165 and VBT242 cells (500,000 cells in 3 μl PBS per mouse) were injected stereotactically into the cortex of 6-week-old female NSG mice ( NOD.Cg-Prkdcscid Il2rgtm1Wjl/SzJ , The Jackson Laboratory, 005557), which were treated with 0.05 mg per kg buprenorphine and anaesthetized with 2% to 3% isoflurane.
The skull of the mouse was exposed through a small skin incision, and a small burr hole was made using a 25-gauge needle at the selected stereotactic coordinates: 1.0 mm x , 1 mm y and −1.5 mm z .
After injection, mice were checked daily for signs of distress, including seizures, weight loss or tremors.
Tumour size was monitored monthly by small animal MRI and BLI starting 4 weeks after injection.
Mice were euthanized as they developed neurologic symptoms, including head tilt, seizures, sudden weight loss, loss of balance and/or ataxia according to IACUC defined endpoints for central nervous system tumours.
No mice exceeded these endpoints.
Sample sizes were determined with reference to previous studies to provide sufficient statistical power for detecting biologically meaningful differences.
Mice were randomized to experimental groups at the start of each experiment when possible.
Blinding was not performed during data collection, but analyses were conducted according to predefined criteria to reduce bias.
All animal studies were performed according to protocols approved by the Dana Farber Cancer Institute Institutional Animal Care and Use Committee (IACUC; 13-053).
Molecular classification through DNA-methylation profiling was performed using the Heidelberg Brain Tumour Methylation Classifier v.12.4 ( https://app.epignostix.com/ ) as previously described 49 .
Genome-wide DNA methylation profiling was performed using the Infinium HumanMethylation 450k or EPIC Kit according to the manufacturer’s instructions (Illumina).
Raw signal intensities from the resulting .idat files were calculated using the minfi Bioconductor package v.1.24.0.
The normalization and batch effect correction were performed using the limma package v.3.34.5.
Afterwards, β values were calculated before selecting CpG probes for downstream analysis.
Unsupervised nonlinear dimensionality reduction was performed using the 1 − variance-weighted Pearson correlation between the samples to construct the distant matrix, which was subsequently used as an input for a t -distributed stochastic neighbour embedding visualization.
Classification was performed using the established random-forest algorithm of the Heidelberg Brain Tumour Methylation Classifier v.12.4, which included all molecular EPN groups, including the newly established ST-EPN clusters derived in previous studies 13 , 14 .
Gene fusion status for most cases was derived from earlier studies 13 , 14 using either RNA-seq or PCR with reverse transcription as described in the respective studies.
The gene fusions and their respective isoforms were derived using two independent methods: InFusion and Arriba 50 , 51 .
As described previously 15 , primary cultures of rat cortical neurons and astrocytes were prepared from E19 embryos.
They were plated at a density of 90,000 cells per cm 2 on 12 mm diameter coverslips on 24-well plates that were previously coated with poly- l -lysine.
The cells were maintained in neurobasal medium supplemented with B27 supplement (50×, 2% v/v) and l -glutamine (0.5 mM).
After 7 days, Accutase-dissociated cells from patient-derived ZFTA-RELA cell lines were added and co-cultured (1,000 cells per well).
For time-lapse live-cell imaging or immunohistochemistry, coverslips were used 4–14 days in vitro after seeding ZFTA-RELA cells.
As a control, in vitro monocultures of ZFTA-RELA cells were established from patient-derived ZFTA-RELA cell lines as follows: 12-mm-diameter coverslips on 24-well plates were coated using poly -l -lysine and maintained in neurobasal medium supplemented with B27 supplement (50x, 2%, v/v) and l -glutamine (0.5 mM).
After 7 days, Accutase-dissociated ZFTA-RELA cells were added and cultured (1,000–10,000 cells per well).
For time-lapse live-cell imaging immunohistochemistry, coverslips were used 4–14 days in vitro after seeding ZFTA-RELA cells.
iPS cell lines were obtained from the Boston Children’s Hospital Human Neuron Core, with all appropriate permissions for use.
Induced neurons were generated from the GON0515-03 iPS cell line according to established protocols 52 .
In brief, iPS cells were plated at a density of 95,000 cells per cm 2 on Geltrex-coated plates in mTeSR1 medium (StemCell Technologies, 85850) for viral transduction.
The following lentiviral plasmids were obtained from Addgene: FUdeltaGW-rtTA (Addgene, 19780), a gift from K.
Hochedlinger; pTet-O-Ngn2-puro (Addgene, 52047) and Tet-O-FUW-eGFP (Addgene, 30130), both gifts from M.
Wernig.
High-titre lentiviruses (~1 × 10 9 transducing units per ml) were generated by Alstem and used at the following concentrations: 0.13 µl per 50,000 cells for each virus.
After transduction, cells were dissociated with Accutase (StemCell Technologies, AT104-500) and replated at a density of 200,000 cells per cm 2 on Geltrex-coated plates in mTeSR1 medium supplemented with ROCK inhibitor (10 µM, StemCell Technologies, 72304) (day 0).
On day 1, the medium was replaced with N2 medium supplemented with doxycycline (2 µg ml −1 , Clontech, NC0424034), brain-derived neurotrophic factor (BDNF; 10 ng µl −1 , Peprotech), neurotrophin-3 (NT3; 10 ng µl −1 , Peprotech, 450-03) and laminin (0.2 µg µl −1 , Life Technologies, 23017015).
Doxycycline was maintained throughout the differentiation protocol.
On day 2, medium was switched to N2B medium containing BDNF, NT3, laminin (same concentrations), Ara-C (2 µM, Sigma-Aldrich, 1768-100MG) and puromycin (1 µg ml −1 , Gibco, A11138-03).
From day 3 onward, cells were cultured in N2B medium supplemented with 1× B27 (Life Technologies, 17504044), doxycycline (2 µg ml −1 ), puromycin (5 µg ml −1 ), BDNF, NT3 and laminin, with half-medium changes performed every other day.
At day 6, puromycin was withdrawn and cells were enzymatically dissociated using the Papain Dissociation System (Worthington Biochemical, LK003150) for downstream experimental setups.
Induced neurons were plated on poly- d -lysine and laminin-coated six-well plates or 15 mm glass coverslips in co-culture with iPS-cell-derived human astrocytes (Ncardia, M0605), which were added at 10–15% of the total neuron cell density.
Human iPS-cell-derived Ncyte Astrocytes (Ncardia, M0605) were cultured in T75 flasks (Thermo Fisher Scientific) precoated with poly- d -lysine (R&D Systems, 3439-200-01).
Cells were maintained in Astrocyte Medium (ScienCell, 1801), consisting of 500 ml of basal medium (1801), 10 ml of FBS (0010), 5 ml of astrocyte growth supplement (AGS, 1852) and 5 ml of penicillin–streptomycin solution (0503).
Half-medium changes were performed every other day.
Before co-culture, astrocytes were enzymatically dissociated using Accutase (StemCell Technologies) and subsequently plated together with day 6 iPS-cell-derived neurons.
Astrocytes were added at a final density corresponding to 10–15% of the total neuronal cell count and maintained in neuronal medium.
On day 18 of human iPS-cell-derived neurons differentiation, ZFTA-RELA tumour cells were added to neuronal cultures at a ratio of 1:3 (tumour:neuron).
Cocultures were monitored for 7 days and maintained with half-medium changes every other day with B27 medium, doxycycline (2 µg ml −1 ), puromycin (5 µg ml −1 ), BDNF (10 ng µl −1 ), NT3 (10 ng µl −1 ) and laminin (0.2 ng µl −1 ).
For all scRNA-seq experiments, cocultures were dissociated using the Papain Dissociation System after the 7-day coculture period.
To assess the role of neuronal activity on tumour cell behaviour, cocultures were treated with either tetrodotoxin (1 µM, Tocris, 1069) or vehicle control.
Live cells were isolated from immediately processed fresh tumour tissue acquired at the time of surgery.
Fresh tumour tissue was mechanically dissociated and enzymatically digested using the Brain Tumour Dissociation Kit (Miltenyi Biotec, 130-095-942) and gentleMACS dissociator (Miltenyi Biotec, 130-096-427) for 30 min at 37 °C.
Single-cell suspensions were filtered through a 70 µm strainer (Thermo Fisher Scientific, 03-421-228), centrifuged at 500 g for 5 min and resuspended in a solution of 1% BSA (BioLegend, 644710) in PBS for fluorescence-activated cell sorting (FACS).
Nuclei for snRNA-seq were extracted from snap-frozen and optimal cutting temperature (OCT)-embedded tumour tissues.
Snap-frozen tumour tissue was cut on ice, while OCT-embedded tissue was cut on a cryostat at −20 °C and washed with PBS.
Frozen tumour tissue was suspended in cell lysis buffer (CST) and dissociated with sterile surgical scissors for 5 min until homogenous.
Dissociated tissue was filtered through a 70 µm strainer, 1XST was added to the nucleus solution and once more transferred through a 70 µm strainer.
The nucleus solution was centrifuged at 500 g for 5 min.
Single-nucleus suspensions were resuspended in PBS supplemented with 1% BSA (Smart-seq2) or 0.05% BSA (10x Genomics).
All steps were performed at 4 °C.
A single-cell suspension of 100 μl (kept in a FACS-tube in PBS/BSA at 4 °C) was used for all sorting procedures as an unstained control.
For stained controls, 0.75 μl Calcein AM (Life technologies, C34851) and 0.5 μl TO-PRO3 Iodide (Life technologies, T3605) were added to resuspended cells in 100 μl PBS/1% BSA for 10 min at room temperature.
Single-cell sorting was performed on the MA900 sorter (Sony).
Single viable tumour cells were selected by positive staining for Calcein AM as well as negative staining for TO-PRO3 and sorted into pre-chilled (4 °C) 96-well plates containing TCL buffer (Qiagen, 1031576) + 1% β-mercaptoethanol (Thermo Fisher Scientific, 21985023).
Sorted plates were centrifuged at 1,000 g for 1 min at 4 °C and frozen on dry ice followed by transfer to a −80 °C freezer for long-term storage before whole-transcriptome amplification, library preparation and sequencing.
Dissociated frozen tumour tissue derived single-nucleus suspensions were resuspended in PBS 1% BSA and stained with 2.5 mM Vybrant DyeCycle Ruby Stain (Life Technology, V10309).
Nucleus sorting was performed on the MA900 sorter (Sony).
Intact nuclei were sorted into prechilled (4 °C) 96-well plates containing TCL buffer + 1% β-mercaptoethanol.
Sorted plates were centrifuged at 1,000 g for 1 min at 4 °C and frozen on dry ice followed by transfer to a −80 °C freezer for long-term storage before whole-transcriptome amplification, library preparation and sequencing.
Day 8 in vitro coverslips of mono- and co-culture were incubated with trypsin for 5 min.
Next, 10% FBS was added, and cells were washed from coverslips.
The samples were stained with a DAPI as a dead cell marker to identify the live-cell population.
The single-cell suspension was sorted with a FACSAria Fusion 2 (BD Biosciences).
Tumour cells were identified by their tdTomato expression.
Smart-seq2 whole-transcriptome amplification, library preparation and sequencing of single cells/nuclei were performed according to the modified Smart-seq2 protocol as previously described 1 , 53 , 54 .
RNA was purified with RNAClean XP beads (Beckman Coulter, A66514).
Next Oligo-dT primed reverse transcription was performed using Maxima H Minus reverse transcriptase (Life Technologies, EP0753) and a template-switching oligonucleotide (TSO; Qiagen) followed by PCR amplification (20 cycles for scRNA-seq and 22 cycles for snRNA-seq) using the KAPA HiFi HotStart ReadyMix (KAPA Biosystems, 07958935001), and by AMPure XP bead (Beckman Coulter, A63882) purification.
Libraries were generated using the Nextera XT Library Prep kit (Illumina, FC-131-1096).
Libraries from 768 cells with unique barcodes were combined and sequenced using the NextSeq 500/550 High Output Kit v2.5 (Illumina, 20024906) on the NextSeq 500 sequencer (Illumina).
We aligned raw sequencing reads to hg19 genome by hisat2 (v.2.1.0) and quantified gene counts using RSEM (v.1.3.0) as raw counts.
For Smart-seq2 data of frozen tumours, we excluded cells with genes <1,000 and an alignment rate of <0.1; for fresh tumours, the filtering threshold was <2,500 genes and an alignment rate of <0.2.
We also removed genes with TPM >16 in <10 cells.
For the remaining good-quality cells and genes, we computed the aggregate expression of each gene as E a ( i ) = log 2 [average (TPM i ,1, …, n ) + 1] and defined relative expression as centred expression levels, E r i , j = E i , j − average (E i ,1, …, n ).
In total, 7,873 high-quality cells were retained frozen tumours, and 1,093 for fresh tumours for downstream analysis.
On average, we detected 3,660 unique genes per cell in frozen tumours, and 5,815 unique genes per cell in fresh tumours.
To discriminate between malignant and non-malignant cells, we used (1) Seurat clustering; (2) unbiased cell type annotation using the automated annotation package SingleR (v.1.6.1) using the Human Primary Cell Atlas 55 as a reference; and (3) inference of copy-number variation (CNV) using the InferCNV R package (v.1.8.0).
We began by performing an initial annotation of cell lineages through dimensionality reduction using UMAP and unsupervised Louvain clustering.
To refine our classifications, we analysed clustering patterns and the expression of established immune, endothelial and oligodendrocyte gene markers.
We validated these initial lineage assignments using the automated annotation package SingleR, which assigns cell identities on the basis of their similarity to a reference set of bulk transcriptomes from healthy cells (Human Primary Cell Atlas data 55 ).
We then inferred genome-wide evidence for somatic chromosomal CNV using the InferCNV R package as previously described 1 , 53 , 54 .
We spiked-in non-malignant immune and oligodendrocyte nuclei from previous publications 1 , 53 , 54 as reference normal karyotype for CNV inference, and used hierarchical clustering of the single-cell copy-number profiles within each sample with the reference non-malignant copy-number profiles to classify the presence of CNVs.
Owing to the presence of false-positive/false-negative rates of inferring CNVs with nuc-seq data from frozen samples, CNV results were used as secondary validations.
CNVs should be detected in cell clusters classified as malignant cells by transcriptional clustering.
By contrast, CNVs should be absent from cell clusters classified as a normal cell type.
Reassuringly, we observed that nuclei lacking CNVs typically clustered together and were identified as macrophage, T cell or endothelial cell nuclei based on their high expression of myeloid, T cell or endothelial markers, respectively.
All other clusters consistently exhibited CNVs and were classified as malignant tumour cells.
Only cells identified as malignant were selected for subsequent NMF analysis.
To identify heterogeneous transcriptional programs within each sample, we performed NMF analysis using frozen tumours profiled by snRNA-seq.
As input for NMF, we selected the top 10,000 overdispersed genes using PAGODA2 (v.0.1.4) identified on the malignant cell compartment of each sample separately.
We set the negative values to zero and ran NMF package (v.0.28) using rank = 6.
To identify metaprograms (MPs), we first scored all malignant cells for the top 30 genes with the highest score from each NMF factor as explained in the ‘Scoring gene sets’ section.
We next clustered the resulting scores across all NMF programs by hierarchical clustering as explained in the ‘Program-wise hierarchical clustering’ section and used the function cutree from the stats R package (v.4.4.2) to automatically extract n = 15–20 highly correlated MPs.
We finally curated the resulting clusters manually, by (1) removing clusters that were associated with limited samples (and therefore considered to not to reflect relevant general biology of the tumours); (2) removing clusters that were not associated with any significant gene enrichment ontology term; (3) grouping together clusters that reflected similar underlying biological processes.
This approach revealed eight highly correlated sets of programs or MPs within ST-EPN tumours.
To annotate MPs, we used three approaches.
First, we performed GO analysis to identify over-represented biological processes in each metaprogram as described in section: GO and gene set enrichment (GSEA) analysis.
As an input, we used the top 30 marker genes from each MP.
Second, we compared the MPs identified here de novo with MPs that we identified in previous work 15 .
Third, we compared the gene signatures of each MP to a developmental reference scRNA-seq dataset of non-malignant cortical brain development 31 , 32 as described in the ‘Generation of developmental signatures’ section.
Assessment of significant changes in metaprogram proportion were made using the propeller test from the Speckle R package (v.1.8.0) 56 .
Generation of single-cell expression scores
We first aggregated ST-EPN single cells/nuclei from all samples, and performed normalization and centring.
We then scored these cells for NMF/developmental signatures as previously described 1 , 57 , 58 .
We did this by calculating for each cell i a score SC j ( i ), quantifying the average relative expression ( E r ) of the top 30 genes within each MP ( G j ) and comparing the score to the average relative expression of a control gene ( G j cont ): SC j ( i ) = average[ E r ( G j , i )] − average[ E r ( G j cont , i )].
The control gene set was defined by binning all genes into 30 bins of aggregate expression levels ( E a ) and randomly selecting 100 genes from the same expression bin for each gene in the gene-set G j .
ST-EPN cells/nuclei were annotated based on the maximum expression score for the respective MP signatures after excluding the one related to cell cycle (cycling).
We used Seurat’s CellCycleScoring function to assign cell cycle scores.
This function relies on gene signatures that have been previously shown to characterize S and G2/M cell cycle phases.
We defined high-cycling cells as cells with S scores or G2/M scores > 0, and low-cycling cells as cells with S scores < 0 and G2/M scores < 0.
To identify developmental signatures enriched in ST-EPN subtypes or cell states, we performed projection of tumour cells (pseudobulked by ST-EPN subtype or cell state) onto normal cell type signatures.
We first assembled a single-cell reference atlas of the developing human cerebral cortex from two published scRNA-seq datasets 31 , 32 .
We then subset the combined dataset to 500 cells (if available) per cell identity and used Seurat’s RunPrestoAll function (retaining only genes expressed in at least 25% of all cells) to derive the top differentially expressed genes (adjusted P < 0.05) across cell types, which are reflective of developmental-specific cell type signatures.
We then scored all ST-EPN malignant cells with these marker genes and annotated ST-EPN cells based on the maximum expression score for the respective signatures.
To compare sets of NMF programs or MPs, we first scored all ST-EPN cells/nuclei for the program signatures as described in the ‘Scoring gene sets’ section.
After scoring, we performed pairwise correlation for each possible pair of programs and show hierarchical clustering of the scores using a correlation-based distance metric (distance metric: 1 − Pearson correlation; linkage: Ward’s linkage).
We separated ST-EPN cells into neuroepithelial-like/embryonic-like versus neuronal-like/ependymal-like as previously described 58 .
In brief, we first calculated the y axis value as y = max(SC neuroepithelial-like ,SC embryonic-like ) − max(SC neuronal-like ,SC ependymal-like ).
For neuroepithelial-like/embryonic-like cells ( y > 0), the x axis value was defined as x = log 2 (|SC ependymal-like − SC neuronal-like | + 1); and, for neuronal-like/ependymal-like cells ( y < 0), the x axis was defined as log 2 (|SC embryonic-like − SC neuroepithelial-like |).
Differential gene expression analysis
To identify genes that are differentially expressed between two conditions (monoculture versus coculture) or cell states (neuroepithelial-like versus embryonic-like), we first used Seurat’s RunPrestoAll function (retaining only genes minimally detected in 15% cells).
For downstream GO analysis we used the top 30 genes (ordered by average log 2 [FC]) with an average |log 2 [FC]| > 1 and adjusted P -value threshold as indicated in the corresponding figure legend; for GSEA, we used all genes with and an adjusted P -value threshold of 10 −5 .
We performed pseudobulk differential expression analysis to identify transcriptional programs that distinguish ZFTA-RELA from ZFTA cluster 3 tumours.
We first extracted raw count matrices from each tumour sample, and calculated pseudobulked gene expression counts using the SingleCellExperiment (v.1.28.1) aggregateAcrossCells function.
We then conduceted differential gene expression analysis using edgeR (v.0.27).
We filtered out genes with low expression counts using the filterByExpr function, based on our grouping variable (tumour subtype).
We then normalized the counts using the calcNormFactors function.
We constructed a design matrix to include tumour subtype, estimated negative binomial dispersions using the estimateDisp function and fitted a generalized linear model using glmFit, followed by hypothesis testing with glmLRT for differential expression.
We considered significant genes based on a false-discovery rate (FDR) threshold of <0.001.
For downstream GO analysis, we used the top 30 genes (ordered by log 2 [FC]) with FDR < 0.001 and |log 2 [FC]| > 1; for GSEA, we used all genes with FDR < 0.001.
We visualized results using ggplot2 (v.3.5.0).
To identify biological terms that are over-represented in a specific gene set, we performed GO and GSEA analysis using the enrichGO and gseGO functions, respectively, from the clusterProfiler package (v.4.6.2) 59 .
As a database, we used the R package org.Hs.eg.db (v.3.18.0), which is an organism annotation package for Homo sapiens , relying on the Ensembl version released on 10 May 2023.
Unless otherwise stated, we used the following parameters: ont = “ALL”, universe = all genes retained for differential gene expression analysis, minGSSize = 3, maxGSSize = 800, pvalueCutoff = 0.05, OrgDb = org.Hs.eg.db, pAdjustMethod = “BH”.
To validate the preferential mapping of ST-YAP1 versus ZFTA-RELA tumours onto ependymal and neuronal cells, respectively, we downloaded a microarray dataset 2 available on the R2 platform (r2.aml.nl; R2 internal identifier: ps_avgpres_gse64415geo209_u133p2) containing normalized gene expression matrix ( z score) data from n = 49 ZFTA-RELA and n = 11 ST-YAP1 patient tumour samples.
After removing n = 10 ZFTA-RELA and n = 2 ST-YAP1 samples (as they were present in our discovery snRNA-seq cohort), we scored samples using Seurat’s AddModuleScore function, taking the NMF-derived gene signatures described above as the input.
Spatial transcriptomics with 10x Xenium
For in situ 10x Xenium analysis, a custom gene panel of 100 genes was designed to include metaprogram marker genes identified across different types of high-grade gliomas, including: (1) ZFTA-RELA patient tumours analysed in this study ( n = 35 genes); (2) diffuse midline gliomas 35 ( n = 10 genes); (3) glioblastoma 37 ( n = 27 genes); (4) genes that mark the same metaprogram in a combination of tumour types (intersection, n = 10 genes); and (5) normal cell types ( n = 18) (Supplementary Table 6 ).
For ZFTA-RELA tumours, those genes encompassed the following metaprograms: cycling ( n = 4 genes), neuroepithelial-like ( n = 8 genes), radial glial-like ( n = 3 genes), NPC-like ( n = 12 genes), ependymal-like ( n = 8 genes) and mesenchymal-like ( n = 4 genes); and three probes targeting ZFTA-RELA fusion transcripts.
Moreover, we used the human brain predesigned panel containing probes for 272 genes encompassing additional non-malignant cell types (oligodendrocytes, immune cells, endothelial, astrocytes, neurons, microglia and VLMCs).
For detection of fusion transcripts, custom probes were designed for three different fusion sites between the exons of ZFTA and RELA (Supplementary Table 6 ).
The 60 bp area surrounding the fusion site was used to derive junction-specific probes.
For fresh-frozen samples, tissue sections were cut at a thickness of 10 µm using the Leica CM3050S cryostat and collected onto Fisherbrand Superfrost Plus microscope slides, followed by fixation and permeabilization.
For FFPE blocks, 5-µm-thick tissue sections on a Xenium slide underwent deparaffinization and permeabilization.
Hybridization of a mix of predesigned and custom gene expression probes was performed at 50 °C overnight.
After multiple washes to remove unhybridized probes, ligation of probes and annealing of rolling circle amplification primer was performed at 37 °C for 2 h.
Circularized probes were then enzymatically amplified at 30 °C for 2 h, after which background autofluorescence was quenched chemically.
The slides were then loaded into the Xenium Analyzer after nucleus staining.
Image acquisition and sample handling was automated within Xenium Analyzer for two slides per run.
Fifteen rounds of fluorescence probe hybridization, imaging and probe removal occurred within the Analyzer.
A fast area scan camera with ~200 nm per pixel resolution was used for image acquisition, and z stacks were taken with 0.75 μm step size across tissue thickness.
All z -stack of images were then processed and stitched, using DAPI image as reference.
Each fluorescently labelled oligonucleotide bound to amplified barcodes was detected and registered in each cycle.
Unique optical signature from fluorescence intensity over the 15 rounds was used to identify a target gene.
For cell segmentation, neural network was used to detect each nucleus from DAPI images.
The preprocessing of Xenium platform data was conducted using the Seurat pipeline.
Initially, the per-transcript location data, cell × gene matrix, cell segmentation and cell centroid information provided in the Xenium outputs were imported using the LoadXenium function.
Subsequently, SCTransform was used for normalization, followed by standard procedures for dimensionality reduction and clustering.
We defined the spatial coherence score, a measure of how structure or disorganized a tumour is, as follows.
After annotating each cell with a malignant metaprogram or non-malignant cell type, the data were divided into 200 bins per row and column, totalling 40,000 spots per tumour section, each of which was analysed to identify the cells that it contained.
To achieve this, a spot annotation program was developed based on the program with the highest proportion within that spot.
To determine whether a sample is organized or disorganized, a coherence score was calculated by examining each spot and its surrounding 3 × 3 square neighbours.
If the neighbours were found to be like the spot annotation, a score of 1 was added; otherwise, a score of 0 was assigned.
This process was carried out separately for each sample and metaprogram.
The scores for each program were combined and divided by the number of spots associated with that program.
The final coherence score for each sample was calculated by averaging all of the scores calculated for each program across that sample and scaled within 0–1.
We used simple and multiple linear regression to assess whether the abundance of cell state/type is associated with increased spatial coherence as well as to evaluate the concordance between cell state/type abundance identified by sn/scRNA-seq and spatial Xenium analyses.
We performed logit transformation of cell state/type proportion using the logit function from R package car (v.3.1.3).
To make the proportion values 0 and 1 not be infinite values, we applied a small adjustment of 0.025 (default for logit function of car) before value transformation.
After data transformation, we used the lm function from the R stats package (v.4.4.2) to perform simple and multiple linear regression.
We extracted the goodness of fit ( R , R 2 and P ) using the summary() function.
We adjusted P values for multiple comparisons using Bonferroni correction.
Spatial niche analysis was performed for each tumour section in R using the BuildNicheAssay function from Seurat (v.5.0.2), which demarcates regions of tissue defined by a similar composition of spatially adjacent cell types.
This function, which requires a pre-established number of neighbours (neighbours.k set to 20) and expected niches (niches.k set to 6), considers the n = neighbours.k spatially closest neighbours to each cell, counts the occurrences of each cell state/type in this area and uses k -mean clustering to group cells with similar neighbourhoods together to resolve n = niches.k spatial niches for each tumour section.
We applied BuildNicheAssay to our spatial cohort using niches.k = 4–6, and thereby resolved 4, 5 and 6, respectively, niches within each tumour section.
To identify niches that were consistently detected across multiple tumour sections (termed metaniches), we first calculated the relative proportion of each cell state/type within a given niche section.
We then computed correlation matrix between the different niches by hierarchical clustering as explained in the ‘Program-wise hierarchical clustering’ section, to understand how similar the distributions of cell states are across different spatial niches.
Finally, we used the function cutree from the stats R package (v.4.4.2) to automatically extract n = 5–6 highly correlated metaniches.
To simultaneously identify local spatial patterns across multiple samples and provide an orthogonal validation to our niche analysis, we used CellCharter 47 (v.0.3.4) to identify spatial clusters.
To enable joint analysis among different samples, CellCharter applied dimension reduction and batch correction through a variational autoencoder method, scVI.
Next CellChater encoded spatial information into a spatial network based on spatial proximity among cells.
To enable neighbourhood aggregation, CellCharter concatenated features from neighbour cells.
We then performed GMM-based clustering on these concatenated and aggregated features to determine spatial clusters.
We ran GMMs on a wide range of cluster numbers ( N ) to identify a stable cluster number for the final GMM and downstream analysis.
Specifically, N clusters were deemed to be stable if cluster assignments are concordant across multiple runs of GMMs for N , N − 1 and N + 1 based on the Fowlkes–Mallows index.
To evaluate the heterogeneity in abundances of spatial cluster across samples, we computed the Shannon entropy of sample proportions in each spatial cluster.
We first calculated the proportions of cells from different samples within each spatial cluster, as p i .
Next we calculated a Shannon entropy ( H ) using this formula \(H=-{\sum }_{\{i=1\}}^{n}{p}_{i}{\log }_{2}{p}_{i}\) , where n is the total number of samples present in this spatial cluster.
Tissue slides were immersed in haematoxylin for 20 min and washed in distilled water (four times for 1 min).
After washing, the slides were immersed in 70% and 95% ethanol for 3 min, followed by eosin staining for 2 min.
The slides were further dehydrated in serial ethanol incubation, including 95% ethanol (twice for 30 s) and 100% ethanol (twice for 30 s).
Finally, the slides were incubated in xylene for 3 min, and mounted with coverslip to dry for 30 min before proceeding to imaging.
Cells were fixed with 4% paraformaldehyde (Thermo Fisher Scientific, J61899.AP) for 15 min at room temperature.
Cells were washed with PBS and subsequently permeabilized and blocked with 5% normal goat serum (Thermo Fisher Scientific, 10000C) and 0.2% Triton X-100 (Fisher Scientific, AAA16046AE) in PBS (blocking solution) for 30 min at room temperature.
The cells were incubated with primary antibodies overnight at 4 °C in blocking solution.
The primary antibodies used in this study were as follows: anti-beta-III-tubulin (1:100; Novus Biologicals, NB100-1612, TUJ88977978), anti-S100B (1:500, Synaptic Systems, 287 044, 1-16), anti-Nestin (1:2500, Invitrogen, PA5-143578, ZD4294645), anti-vimentin (1:1000, CST, 5741T, 8), anti-DCX (1:50, CST, 40619S, 1), anti-CCDC40 (1:100, Thermo Fisher Scientific, PA5-54653, YI40449391B), anti-GFAP (1:500, Aves Lab, GFAP, GFAP857977) and anti-tdTomato (1:80, CST, 20163S, 1).
The next day, the cells were washed with PBS three times, incubated with fluorophore-conjugated secondary antibodies at 1:1,000 dilutions (goat anti-rabbit IgG (H+L) cross-adsorbed secondary antibody, Alexa Fluor 488, A-11008; goat anti-mouse IgG (H+L) cross-adsorbed secondary antibody, Alexa Fluor 568; A-11004; goat anti-chicken IgY (H+L) secondary antibody, Alexa Fluor 647; A-21449; goat anti-guinea pig IgG H&L Alexa Fluor 750, ab175758) for 1 h at room temperature, and washed with PBS three more times.
Cells were mounted onto SuperFrost Plus microscope slides using ProLong Diamond Antifade Mountant with DNA Stain DAPI (Thermo Fisher Scientific, P36962).
Analysis of immunostaining of treated cells was performed using a ×63 oil-immersion objective on a laser-scanning confocal microscope (Zeiss LSM 980 with Airyscan 2) operated with the Zen Microscopy Software (Zeiss).
All images were processed using ImageJ software (National Institutes of Health).
The tdTomato signal of each cell was segmented by setting a pre-set threshold to capture the morphology and area of the cell.
Automated colocalization of fluorescence analysis was then performed using Coloc 2 to derive Pearson’s Correlation coefficient for colocalization of the tdTomato signal and the other channels.
All of the images were processed using ImageJ software (National Institutes of Health).
10x Xenium slides were precoated with poly- d -lysine and laminin to facilitate cell adhesion.
Rat E19 cortical cells were dissociated and cultured in 10x Xenium slide cassettes (5 × 10 5 cells per cassette) for 5 days in neurobasal medium supplemented with B27 supplement (50×, 2%, v/v) and l- glutamine (0.5 mM).
After 5 days, Accutase-dissociated cells from patient-derived ZFTA-RELA cell lines were added and co-cultured for another 4 days (1–3 × 10 5 cells per cassette).
The slides were then processed using the same 10x Xenium protocol as for patient tissue and loaded into the Xenium Analyzer after nucleus staining.
The same slides after processing on the Xenium Analyzer were stained for tdTomato using anti-tdTomato (1:80, CST, 20163S, 1) and fluorophore-conjugated secondary antibodies at 1:1,000 dilution (goat anti-Rabbit IgG (H+L) Alexa Fluor 647, Invitrogen A-21245).
Analysis of immunostaining was performed using the Leica Thunder Imager Live Cell and 3D assay with a ×20 objective.
All images were processed using ImageJ/Fiji (v.2.14.0) 60 software.
10x Xenium explorer (v.3.0) was used to identify and quantify transcripts from Xenium colocalized with tdTomato signals.
For all in vivo imaging experiments, male NMRI nude mice were used.
All animal procedures were performed in accordance with the European Directive on animal experimentation (2010/63/EU) and institutional laboratory animal research guidelines after approval of the Regierungspräsidium Karlsruhe, Germany.
Efforts were made to minimize animal suffering and to reduce the number of animals used according to the 3R principles.
Mice were clinically scored, and experiments were terminated if they showed marked neurological symptoms or weight loss exceeding 20%.
Before in vivo two-photon imaging, cranial window and tumour implantation was performed as described previously 18 , 27 , 50 , 52 .
Tumour growth was monitored from 2 weeks after tumour implantation.
A Zeiss LSM780 setup equipped with band-pass filter sets of 500–550 nm and 575–610 nm, using a ×20/1.0 NA apochromatic, 1.7-mm working distance, water-immersion objective (Zeiss) was used.
A pulsed Ti:Sapphire laser (Chameleon Discovery NX; Coherent) was used at a wavelength of 960 nm.
Isoflurane gas was diluted in 100% O 2 for intravital imaging.
For the induction of anaesthesia, the mice were exposed to 4% isoflurane.
Isoflurane was lowered to 0.5–2% for the rest of the experiment and was monitored throughout the experiment by checking the breathing rate.
Eye cream was applied after anaesthesia induction.
During imaging, the body temperature was monitored and kept at 37 °C using a temperature sensor and a heating plate.
100 μl fluorescein isothiocyanate–dextran (2 mg mol −1 ) was injected into the tail vein at a concentration of 10 mg ml −1 for an angiogram before in vivo imaging.
A selected field of view was imaged every 5 min for approximately 4 h with a pixel size of 0.59 µm.
The stacks for each time point were hyperstacked and registered in ImageJ/Fiji (v.2.14.0) 60 through the vessel signal using the plugin Correct3D drift.
Time-lapse imaging was performed using a widefield fluorescence microscope (Nikon Ti-HCS) with a ×10 objective (NA 0.3) and ×1.5 zoom; a confocal microscope (Zeiss Celldiscoverer7 with LSM 980) with a ×20 objective (NA 0.7) and ×0.5 zoom; and the Leica Thunder Imager live-cell imager with a ×20 objective.
Coverslips were imaged every 15 min for 8–24 h at 37 °C with 5% CO 2 .
Images were acquired with a pixel size of 486.86 nm (Ti-HCS) or 794.44 nm (CD7).
Cell division was quantified using live-cell time-lapse imaging in cocultures of neurons and ependymoma cells over 15–24 h.
Cells were assigned their morphological cell state at the beginning of each time-lapse and cell division events were manually counted.
Cell migration speed measurement was performed using ImageJ/Fiji(v.2.14.0) 60 .
Images were registered using the HyperStackReg plugin in ImageJ/Fiji.
Cell somata were outlined and the centre point of the cell was determined using the centroid function.
The distance between the centre points of two timepoints was divided by the experimental observation time.
All TM measurements were performed in ImageJ/Fiji 60 .
For both in vivo and in vitro experiments, TM protrusion was defined as TM outgrowth; retraction as decreased growth; and branching as TM dynamics whereby the secondary TM protrudes out of the pre-existing TM as previously described 27 , 52 .
Net TM turnover was measured by measuring the length of all TMs at the starting time point and after 4 h.
Statistical analyses were conducted using R (v.4.3.3) and GraphPad Prism software (v.10).
To determine statistical significance, we first assessed data normality using the Shapiro–Wilk test.
If all groups followed a normal distribution (Shapiro–Wilk P > 0.05), we performed the Student’s t -test.
If one or more groups did not follow a normal distribution (Shapiro–Wilk P < 0.05), we used the nonparametric Kruskal–Wallis test for comparisons across more than two groups.
If the Kruskal–Wallis test was significant, we performed post hoc pairwise comparisons using the Wilcoxon rank-sum test with appropriate (for example, Bonferroni test) multiple-testing correction, or the Dunn’s multiple-comparison test.
Only statistically significant P values are reported.
Datapoints are presented as mean ± s.d.
or mean ± s.e.m., depending on the experiment, as specified in the figure legends.
The box plots follow the Tukey method, with bars extending from the 25th to 75th percentiles and the centre bar indicating the statistical median.
Further information on research design is available in the Nature Portfolio Reporting Summary linked to this article.
All transcriptomics data are available at the Gene Expression Omnibus (GEO), with scRNA-seq data under accession code GSE300150 and spatial data under GSE300146 .
Raw scRNA-seq data have been deposited in the EGA ( EGAS50000001513 ).
We also downloaded the following single-cell gene expression datasets: human cortex development ( https://cells.ucsc.edu/?ds=cortex-dev ) and early human brain ( https://cells-test.gi.ucsc.edu/?ds=early-brain ).
Human reads were aligned to the GRCh37 (hg19) reference genome (Genome Reference Consortium, NCBI, RefSeq GCF_000001405.13 ).
Source data are provided with this paper.
Custom scripts used in data processing and figure creation are available at Zenodo 61 ( https://doi.org/10.5281/Zenodo.17871734 ).
Gojo, J.
et al.
Single-cell RNA-seq reveals cellular hierarchies and impaired developmental trajectories in pediatric ependymoma.
Cancer Cell 38 , 44–59 (2020).
Article CAS PubMed PubMed Central Google Scholar
Pajtler, K.
W.
et al.
Molecular classification of ependymal tumors across all CNS compartments, histopathological grades, and age groups.
Cancer Cell 27 , 728–743 (2015).
Zheng, T.
et al.
Cross-species genomics reveals oncogenic dependencies in ZFTA/C11orf95 fusion-positive supratentorial ependymomas.
Cancer Discov.
11 , 2230–2247 (2021).
Article CAS PubMed Google Scholar
Curtin, S.
C.
& Anderson, R.
N.
Declines in Cancer Death Rates Among Youth: United States, 2001-2021 Data Brief (NCHS, 2023).
Jassim, A., Rahrmann, E.
P., Simons, B.
D.
& Gilbertson, R.
J.
Cancers make their own luck: theories of cancer origins.
Nat.
Rev.
Cancer 23 , 710–724 (2023).
Coorens, T.
H.
H.
& Behjati, S.
Tracing and targeting the origins of childhood cancer.
Annu.
Rev.
Cancer Biol.
6 , 35–47 (2022).
Filbin, M.
& Monje, M.
Developmental origins and emerging therapeutic opportunities for childhood cancer.
Nat.
Med.
25 , 367–376 (2019).
Saleh, A.
H.
et al.
The biology of ependymomas and emerging novel therapies.
Nat.
Rev.
Cancer 22 , 208–222 (2022).
Marinoff, A.
E.
et al.
Rethinking childhood ependymoma: a retrospective, multi-center analysis reveals poor long-term overall survival.
J.
Neurooncol.
135 , 201–211 (2017).
Article PubMed PubMed Central Google Scholar
Pajtler, K.
W.
et al.
The current consensus on the clinical management of intracranial ependymoma and its distinct molecular variants.
Acta Neuropathol.
133 , 5–12 (2017).
Gillen, A.
E.
et al.
Single-cell RNA sequencing of childhood ependymoma reveals neoplastic cell subpopulations that impact molecular classification and etiology.
Cell Rep.
32 , 108023 (2020).
Marusyk, A., Almendro, V.
& Polyak, K.
Intra-tumour heterogeneity: a looking glass for cancer?
Nat.
Rev.
Cancer 12 , 323–334 (2012).
Li, R.
et al.
Mapping single-cell transcriptomes in the intra-tumoral and associated territories of kidney cancer.
Cancer Cell 40 , 1583–1599 (2022).
Greenwald, A.
C.
et al.
Integrative spatial analysis reveals a multi-layered organization of glioblastoma.
Cell 187 , 2485–2501 (2024).
Venkataramani, V.
et al.
Glioblastoma hijacks neuronal mechanisms for brain invasion.
Cell 185 , 2899–2917 (2022).
Nowakowski, T.
J.
et al.
Spatiotemporal gene expression trajectories reveal developmental hierarchies of the human cortex.
Science 358 , 1318–1323 (2017).
Article CAS PubMed PubMed Central ADS Google Scholar
Eze, U.
C., Bhaduri, A., Haeussler, M., Nowakowski, T.
J.
& Kriegstein, A.
R.
Single-cell atlas of early human brain development highlights heterogeneity of human neuroepithelial cells and early radial glia.
Nat.
Neurosci.
24 , 584–594 (2021).
Bird, A.
DNA methylation patterns and epigenetic memory.
Genes Dev.
16 , 6–21 (2002).
Shen, H.
& Laird, P.
W.
Interplay between the cancer genome and epigenome.
Cell 153 , 38–55 (2013).
Lee, D.
D.
& Seung, H.
S.
Learning the parts of objects by non-negative matrix factorization.
Nature 401 , 788–791 (1999).
Article CAS PubMed ADS Google Scholar
Song, R.
et al.
CENPF overexpression in bladder cancer cells enhances proliferation, migration, invasion, and apoptosis.
Sci.
Rep.
15 , 25398 (2025).
von Eyss, B.
et al.
The SNF2-like helicase HELLS mediates E2F3-dependent transcription and cellular transformation.
EMBO J.
31 , 972–985 (2012).
Leon, E., Nde, C., Ray, R.
S., Preciado, D.
& Zohn, I.
E.
ALDH1A2-related disorder: a new genetic syndrome due to alteration of the retinoic acid pathway.
Am.
J.
Med.
Genet.
A 191 , 90–99 (2023).
Varrone, M., Tavernari, D., Santamaria-Martínez, A., Walsh, L.
A.
& Ciriello, G.
CellCharter reveals spatial cell niches associated with tissue remodeling and cell plasticity.
Nat.
Genet.
56 , 74–84 (2024).
Lee, H.-T.
et al.
Phosphorylation-mediated disassembly of C-terminal binding protein 2 tetramer impedes epigenetic silencing of pluripotency in mouse embryonic stem cells.
Nucleic Acids Res.
52 , 13706–13722 (2024).
Li, C.
et al.
Unraveling the role of the WIPF1/ACTN4 complex in podosome formation of human placental EVTs: Insights into recurrent spontaneous abortion.
Genes Dis.
12 , 101665 (2025).
Cebrian-Silla, A.
et al.
Neural stem cell relay from B1 to B2 cells in the adult mouse ventricular-subventricular zone.
Cell Rep.
44 , 115264 (2025).
Leca, I., Phillips, A.
W., Ushakova, L., Cushion, T.
D.
& Keays, D.
A.
Codon modification of Tuba1a alters mRNA levels and causes a severe neurodevelopmental phenotype in mice.
Sci.
Rep.
13 , 1215 (2023).
De Vincenti, A.
P., Bonafina, A., Ledda, F.
& Paratcha, G.
Lrig1 regulates cell fate specification of glutamatergic neurons via FGF-driven Jak2/Stat3 signaling in cortical progenitors.
Development 151 , dev202879 (2024).
Shu, T.
et al.
Doublecortin-like kinase controls neurogenesis by regulating mitotic spindles and M phase progression.
Neuron 49 , 25–39 (2006).
Jacko, M.
et al.
Rbfox splicing factors promote neuronal maturation and axon initial segment assembly.
Neuron 97 , 853–868 (2018).
Canali, G.
et al.
Genetic variants in autism-related CNTNAP2 impair axonal growth of cortical neurons.
Hum.
Mol.
Genet.
27 , 1941–1954 (2018).
Martin, E.
A.
et al.
The intellectual disability gene Kirrel3 regulates target-specific mossy fiber synapse development in the hippocampus.
eLife 4 , e09395 (2015).
Boxer, E.
E.
et al.
Neurexin-3 defines synapse- and sex-dependent diversity of GABAergic inhibition in ventral subiculum.
Cell Rep.
37 , 110098 (2021).
Hawrylycz, M.
J.
et al.
An anatomically comprehensive atlas of the adult human brain transcriptome.
Nature 489 , 391–399 (2012).
Osswald, M.
et al.
Brain tumour cells interconnect to a functional and resistant network.
Nature 528 , 93–98 (2015).
Tetzlaff, S.
K.
et al.
Characterizing and targeting glioblastoma neuron-tumor networks with retrograde tracing.
Cell 188 , 390–411 (2025).
Komuro, H.
& Rakic, P.
Dynamics of granule cell migration: a confocal microscopic study in acute cerebellar slice preparations.
J.
Neurosci.
15 , 1110–1120 (1995).
Cooper, J.
A.
Mechanisms of cell migration in the nervous system.
J.
Cell Biol.
202 , 725–734 (2013).
Marín, O., Valiente, M., Ge, X.
& Tsai, L.
H.
Guiding neuronal cell migrations.
Cold Spring Harb.
Perspect.
Biol.
2 , a001834 (2010).
Martini, F.
J.
et al.
Biased selection of leading process branches mediates chemotaxis during tangential neuronal migration.
Development 136 , 41–50 (2009).
Tauziède-Espariat, A.
et al.
Supratentorial non-RELA, ZFTA-fused ependymomas: a comprehensive phenotype genotype correlation highlighting the number of zinc fingers in ZFTA-NCOA1/2 fusions.
Acta Neuropathol.
Commun.
9 , 135 (2021).
Ghasemi, D.
R.
et al.
EPEN-14.
Molecular markers and predictors of outcome for paediatric intracranial ependymoma in the prospective, multicentre E-HIT2000 trial and subsequent hit-registries: a pooled analysis of 244 patients.
Neuro.
Oncol.
https://doi.org/10.1093/neuonc/noae064.216 (2024).
Michealraj, K.
A.
et al.
Metabolic regulation of the epigenome drives lethal infantile ependymoma.
Cell 181 , 1329–1345.e24 (2020).
Adler, M.
et al.
Emergence of division of labor in tissues through cell interactions and spatial cues.
Cell Rep.
42 , 112412 (2023).
Christofori, G.
Cancer: division of labour.
Nature 446 , 735–736 (2007).
Milde, T.
et al.
A novel human high-risk ependymoma stem cell model reveals the differentiation-inducing potential of the histone deacetylase inhibitor Vorinostat.
Acta Neuropathol.
122 , 637–650 (2011).
Lötsch, D.
et al.
Targeting fibroblast growth factor receptors to combat aggressive ependymoma.
Acta Neuropathol.
142 , 339–360 (2021).
Capper, D.
et al.
DNA methylation-based classification of central nervous system tumours.
Nature 555 , 469–474 (2018).
Okonechnikov, K.
et al.
InFusion: advancing discovery of fusion genes and chimeric transcripts from deep RNA-sequencing data.
PLoS ONE 11 , e0167417 (2016).
Uhrig, S.
et al.
Accurate and efficient detection of gene fusions from RNA sequencing data.
Genome Res.
31 , 448–460 (2021).
Zhang, Y.
et al.
Rapid single-step induction of functional neurons from human pluripotent stem cells.
Neuron 78 , 785–798 (2013).
Liu, I.
et al.
GABAergic neuronal lineage development determines clinically actionable targets in diffuse hemispheric glioma, H3G34-mutant.
Cancer Cell 42 , 1528–1548 (2024).
Liu, I.
et al.
The landscape of tumor cell states and spatial organization in H3-K27M mutant diffuse midline glioma across age and location.
Nat.
Genet.
54 , 1881–1894 (2022).
Regev, A.
et al.
The human cell atlas.
eLife 6 , e27041 (2017).
Phipson, B.
et al.
propeller: testing for differences in cell type proportions in single cell data.
Bioinformatics 38 , 4720–4726 (2022).
Filbin, M.
G.
et al.
Developmental and oncogenic programs in H3K27M gliomas dissected by single-cell RNA-seq.
Science 360 , 331–335 (2018).
Neftel, C.
et al.
An integrative model of cellular states, plasticity, and genetics for glioblastoma.
Cell 178 , 835–849 (2019).
Wu, T.
et al.
clusterProfiler 4.0: a universal enrichment tool for interpreting omics data.
Innovation 2 , 100141 (2021).
CAS PubMed PubMed Central Google Scholar
Schindelin, J.
et al.
Fiji: an open-source platform for biological-image analysis.
Nat.
Methods 9 , 676–682 (2012).
This work was supported by funding from a Distinguished Scientist Award from the Sontag Foundation (to M.G.F.), a Career Award for Medical Scientist from the Burroughs Wellcome Fund (to M.G.F.), the NIH Director’s New Innovator Award (DP2) (to M.G.F.), a U54 ROBIN grant (NIH/NCI U54 CA274516) (to M.G.F.), a SPORE grant (NIH P50CA165962) (to M.G.F.), Matthew Parker & Kelsey Rioux-Parker (to M.G.F.), Links Fore Liam (to M.G.F.) and the Ependymoma Research Foundation (to M.G.F.).
S.G.D.
was supported by the Swiss National Science Foundation (grant number P500PB_217787); K.K.M by CERN Robert Connor Dawes Scientific Fellowship from the National Brain Tumour Society.
The work was also supported by the Deutsche Forschungsgemeinschaft (DFG, German Research Foundation), SFB 1389, UNITE Glioblastoma, project ID 404521405 (to V.V., S.K.T.
and E.R.) and project number VE1373/2-1516 (to V.V.).
E.R.
and S.K.T.
were supported by the Deutsche Krebshilfe (German Cancer Aid, Mildred Scheel scholarship for MD students).
V.V.
received financial support from the Else Kröner-Fresenius-Stiftung (2020-EKEA.135), Heidelberg University, the European Center for Neurooncology (EZN), the Health + Life Science Alliance Heidelberg Mannheim, Heidelberg University, the Schwiete-Stiftung, the Wilhelm-Sander-Stiftung, the Stiftung Sibylle Assmus, the Sabrina Kaiser Consortium for Astrocytoma Research, the Aventis Foundation, the Research Seed Capital (RiSC) from Ministry of Science, Research, and the Arts Baden Württemberg.
Medical-Scientific Fund of and the Mayor of Vienna (project 14015 to J.G.), the Verein unser_kind, the Forschungsgesellschaft für Cerebrale Tumore and Initiative Krebsforschung Anniversary fund of the Austrian National Bank (project 16152 to J.G.).
D.R.G., K.K.M.
and K.W.P.
received funding by the foundation Ein Kiwi gegen Krebs.
Some illustrations were created using BioRender.
These authors contributed equally: Daeun Jeong, Sara G.
Danielli
These authors jointly supervised this work: Kristian W.
Pajtler, Varun Venkataramani, Mariella G.
Filbin
Department of Pediatric Oncology, Dana-Farber Boston Children’s Cancer and Blood Disorders Center, Boston, MA, USA
Daeun Jeong, Sara G.
Danielli, Li Jiang, Shashank Katiyar, Costanza Lo Cascio, Sina Neyazi, Carlos Alberto Oliveira de Biagi-Junior, Elsa Couvillon, Sophia Castellani, Maria Pazyra-Murphy, Matthew Mullally, Bernhard Englinger, Andrezza Nascimento, Gustavo Alencastro Veiga Cruzeiro, Joana G.
Marques, Rebecca D.
Haase, Cuong M.
Nguyen, Alicia-Christina Baumgartner, Jacob S.
Rozowsky, Olivia A.
Hack, McKenzie L.
Shaw & Mariella G.
Filbin
Broad Institute of MIT and Harvard, Cambridge, MA, USA
Hopp Childrens Cancer Center (KiTZ), Heidelberg, Germany
Kendra K.
Maaß, David R.
Ghasemi, Julia K.
Sundheimer, Andrey Korshunov, Stefan M.
Pfister, Marcel Kool & Kristian W.
Pajtler
Division of Pediatric Neurooncology, German Cancer Consortium (DKTK), German Cancer Research Center (DKFZ), Heidelberg, Germany
Kendra K.
Maaß, David R.
Ghasemi, Julia K.
Sundheimer, Stefan M.
Pfister, Marcel Kool & Kristian W.
Pajtler
Department of Pediatric Oncology, Hematology and Immunology, Heidelberg University Hospital, Heidelberg, Germany
David R.
Ghasemi, Stefan M.
Pfister & Kristian W.
Pajtler
National Center for Tumor Diseases (NCT) Heidelberg, Heidelberg, Germany
David R.
Ghasemi, Andrey Korshunov, Stefan M.
Pfister, Marcel Kool & Kristian W.
Pajtler
Department of Pediatric Hematology and Oncology, University Medical Center Hamburg-Eppendorf, Hamburg, Germany
Research Institute Children’s Cancer Center, Hamburg, Germany
Neurology Clinic and European Center for Neurooncology, University Hospital Heidelberg, Heidelberg, Germany
Svenja K.
Tetzlaff, Ekin Reyhan, Marc Philipp Dehler & Varun Venkataramani
Clinical Cooperation Unit Neurooncology, German Cancer Consortium (DKTK), German Cancer Research Center (DKFZ), Heidelberg, Germany
Department of Urology, Comprehensive Cancer Center, Medical University of Vienna, Vienna, Austria
Department of Neurosurgery, Comprehensive Cancer Center, Medical University of Vienna, Vienna, Austria
Daniela Lotsch-Gojo & Johannes Gojo
Department of Pediatrics and Adolescent Medicine, Comprehensive Center for Pediatrics and Comprehensive Cancer Center, Medical University of Vienna, Vienna, Austria
Clinical Cooperation Unit Neuropathology, German Cancer Consortium (DKTK), German Cancer Research Center (DKFZ), Heidelberg, Germany
Department of Neuropathology, Heidelberg University Hospital, Heidelberg, Germany
Princess Máxima Center for Pediatric Oncology, Utrecht, The Netherlands
University Medical Center Utrecht (UMCU), Utrecht, The Netherlands
Department of Neurological Surgery, University of California, San Francisco, CA, USA
Department of Neurosurgery, Boston Children’s Hospital, Boston, MA, USA
Department of Pathology, Boston Children’s Hospital, Boston, MA, USA
Search author on: PubMed Google Scholar
D.J.
and S.G.D.
conceived the study, designed the experiments, interpreted results, curated the data and wrote the manuscript with input from all of the other authors.
K.K.M.
and D.R.G.
generated DNA methylation and fusion data.
S.K.T.
and E.R.
generated and analysed coculture and in vivo two-photon imaging experiments with the help of C.L.C., E.C., M.P.-M., G.A.V.C., J.K.S.
and M.P.D.; L.J., S.K., C.A.O.d.B.-J., S.N., R.D.H., M.M.
and C.M.N.
generated and analysed 10x Xenium data.
A.N., B.E., C.M.N., A.-C.B., S.C., J.S.R., O.A.H.
and M.L.S.
generated scRNA-seq data, and S.K.
and L.J.
contributed to the analysis.
D.L.-G., K.B., M.K., J.G., A.K., S.M.P.
and L.B.
generated resources.
T.J.N., J.G.M.
and S.A.
provided consultation.
K.W.P., V.V.
and M.G.F.
conceived and supervised the study, interpreted results and wrote the manuscript with input from all of the other authors.
Correspondence to Mariella G.
Filbin .
M.G.F.
is a consultant for Twentyeight-Seven Therapeutics and Blueprint Medicines.
The other authors declare no competing interests.
Nature thanks Michelle Monje, Steven Sloan and the other, anonymous, reviewer(s) for their contribution to the peer review of this work.
Peer reviewer reports are available.
Publisher’s note Springer Nature remains neutral with regard to jurisdictional claims in published maps and institutional affiliations.
Extended data figures and tables
Extended Data Fig.
1 ST-EPN cell type expression patterns and copy number variations of malignant cells.
( a ) UMAP plot of all ST-EPN patient cells/nuclei ( n = 7,840) profiled by sc/snRNA-seq.
Plots are coloured by: inferred malignant status based on copy number variation (CNV, left panel) and final cell type classification (right panel).
( b ) Dotplot showing scaled mRNA expression of canonical marker genes of myeloid ( CD14, SPP1, CCL3 ), T-cells ( PYHIN1, CD247, CD3D ), oligodendrocytes ( MOG, MAG, MBP ) and endothelial cell types ( VWF, CLDN5 ) across all ST-EPN cells profiled by sc/snRNA-seq.
( c ) UMAP plot of all ST-EPN patient cells/nuclei ( n = 7,840) coloured by expression of canonical marker genes of myeloid ( CD14, CSF1R, CD163 ), T-cells ( CD3E, CD4 ), oligodendrocytes ( MBP, PLP1, TF ) and endothelial markers ( VWF, CLDN5 ).
( d ) CNV profiles of each cell (y-axis) across chromosomal location (x-axis) inferred from sc/snRNA-seq data.
Cells are coloured by tumour subtype and ordered according to hierarchical clustering.
Cells are split by inferred malignant/non-malignant origin.
Representative fresh spike-in nonmalignant (NM) cells are shown at the bottom.
( e ) UMAP plot of all ST-EPN patient cells/nuclei coloured by sample of origin.
( f ) UMAP plot of cell types present during the first, second and third trimester of human cortical development 16 , 17 , coloured by developmental trimester (left panel) or cell type (right panel), as specified in the original publication.
The original datasets were subset to n = 500 cells for each cell type, when available.
First-Early: post-conception week (PCW) 4, First-Middle: PCW 5-6, First-Late: PCW 7-13.
( g ) Dotplot depicting the proportion of each cell type (y-axis) in each age in weeks (PCW) (y-axis) in the reference human cortical development scRNA-seq dataset 16 , 17 .
Extended Data Fig.
2 Annotation and pathways analysis of ST-EPN metaprograms.
( a ) Projection of each of ST-EPN tumour samples (y-axis) onto developmental timepoints in the reference scRNA-seq dataset 16 , 17 (First-Early: post-conception week (PCW) 4, First-Middle: PCW 5-6, First-Late: PCW 7-13).
( b ) Projection of ST-EPN cell states (y-axis) onto cell types present during the first, second and third trimester of human cortical development 16 , 17 .
( c ) Top five biological pathways enriched across the identified ST-EPN metaprograms by GO analysis of the top 30 NMF marker genes.
For each pathway, enrichment p-values were computed by one-sided hypergeometric test.
Reported adjusted p-values correspond to Benjamini-Hochberg false discovery rate (FDR)-corrected p-values.
( d ) Pairwise Pearson correlation between ST-EPN metaprograms identified in this study using top 30 marker genes of metaprograms in frozen tumour samples (red font) and previously defined metaprograms 1 identified across different types of ependymoma (SP: spinal; ST: supratentorial; PF: posterior fossa).
( e ) Cell state plot coloured by inferred cycling status.
Cycling metaprogram is excluded from this plot.
The frequency of cycling and non-cycling cell within each quadrant is displayed in the pie charts.
( f ) Barplot showing the proportion of cycling and non-cycling cells across ST-EPN cell states, ordered from the most (left) to the least (right) proliferative.
( g ) Volcano plot showing genes differentially expressed between neuroepithelial-like and embryonic-like ST-EPN cells using two-sided Wilcoxon rank-sum test and Bonferroni-corrected.
Genes with |log2FC | > 1 and adjusted P-value < 0.00001 are highlighted in colour.
( h ) Top 10 gene ontology (GO) terms identified for neuroepithelial-like and embryonic-like ST-EPN cells.
For each GO term, enrichment p-values were computed by one-sided hypergeometric test.
Reported adjusted p-values correspond to Benjamini-Hochberg false discovery rate (FDR)-corrected p-values.
( i ) Top 10 pathways identified by GSEA analysis comparing genes differentially expressed (input for GO: |log2FC | > 1 and adjusted P-value < 0.00001, input for GSEA: adjusted P-value < 0.00001) between neuroepithelial-like and embryonic-like ST-EPN cells based on the genes identified in ( g ).
Extended Data Fig.
3 Comparison of metaprogram abundance and genes between ST-EPN subgroups.
( a ) Boxplots depicting proportion of each metaprogram (y-axis) across ST-EPN subgroups (x-axis) ( n = 7046 cells/nuclei examined).
False discovery rate (FDR) calculated by propeller test in R package Speckle 56 .
Box plots show the median (centre line), 25th–75th percentiles (bounds of the box), and whiskers extending to the minimum and maximum values within 1.5 times the interquartile range; points beyond the whiskers represent outliers.
( b ) Volcano plot showing genes differentially expressed between ZFTA-RELA and ZFTA-Cluster 3 tumours.
Cells were pseudobulked by sample, and differential gene expression analysis was run using edgeR (v0.27).
Genes with |log2FC | > 1 and FDR < 0.001 are highlighted in colour.
( c ) Top 10 gene ontology (GO) terms identified comparing genes differentially expressed (input for GO: |log2FC | > 1 and FDR < 0.001, input for GSEA: FDR < 0.001) between ZFTA-RELA and ZFTA-Cluster 3 tumours based on the genes identified in ( b ).
For each GO term, enrichment p-values were computed by one-sided hypergeometric test.
Reported adjusted p-values correspond to Benjamini-Hochberg false discovery rate (FDR)-corrected p-values.
( d ) Top 10 pathways identified by GSEA analysiscomparing genes differentially expressed (input for GO: |log2FC | > 1 and adjusted P-value < 0.00001, input for GSEA: adjusted P-value < 0.00001) between ZFTA-RELA and ZFTA-Cluster 3 tumours identified in ( b ).
( e ) Cell state plots of ST-EPN tumour cells/nuclei profiled in this publication and pseudo-bulked by sample of origin (“Discovery cohort”, top) and of an external patient cohort 2 profiled by bulkRNA-seq (“Validation cohort”, bottom).
Samples were scored for metaprogram signatures identified by NMF analysis (top 30 genes) and coloured by molecular subtype.
( f ) Violin plots showing gene expression module scores of cell state signatures across ST-EPN samples profiled by bulkRNA-seq in an external cohort 13 (ZFTA-RELA samples n = 39; ST-YAP1 samples n = 9).
Violin plots are overlaid with box plots indicating the median (centre line), 25th–75th percentiles (bounds of the box), and whiskers extending to the minimum and maximum values within 1.5 times the interquartile range.
Bonferroni-corrected significant P-values calculated by two-sided Wilcoxon-rank sum test are shown.
AU, arbitrary unit.
( g ) Violin plot showing gene expression module scores of ependymal-like and neuronal-like signatures in ZFTA-RELA samples profiled by bulkRNA-seq in an external cohort 13 (ZFTA-RELA samples n = 39).
Violin plots are overlaid with box plots indicating the median (centre line), 25th–75th percentiles (bounds of the box), and whiskers extending to the minimum and maximum values within 1.5 times the interquartile range.
Significant p-value calculated by two-sided Wilcoxon-rank sum test are shown.
AU, arbitrary unit.
Extended Data Fig.
4 Spatial cell type assignment, prevalence, and correlation to spatial coherence across samples.
( a ) Spatial maps of STEPN-19 coloured by: patient tumours sc/snRNAseq projection signature scores (left), representative marker gene expression (middle), and final cell type assignment (right) for MES/Hypoxia and endothelial clusters (all other clusters are shown in grey).
( b ) Correlation between the transformed proportion of cell states/types detected in ZFTA-RELA tumours profiled by snRNA-seq and by 10X Xenium.
Data points are interpolated with a simple linear regression, where p-values are calculated from t-statistic (two-tailed test).
The goodness of fit (R, R 2 ) and P-value are displayed at the top.
The grey shaded band denotes the 95% confidence interval for the mean fitted response at each x-value.
( c ) Dotplot showing expression of ZFTA-RELA fusion transcripts across the identified cell types in all ZFTA-RELA patient samples profiled by 10X Xenium.
( d ) Proportion of tumour metaprograms and non-malignant cell types (y-axis) in all ZFTA-RELA tumour sections profiled by 10X Xenium (x-axis).
Example disorganized and organized tumour sections displayed in bottom row.
( e ) Correlation between the spatial coherence score and the logit transformed proportion of individual cell states/types cells in ZFTA-RELA tumour sections profiled by 10X Xenium.
Data points (representing mean value across tumour sections per sample) are interpolated with a simple linear regression, where p-values are calculated from t-statistic (two-tailed test).
The goodness of fit (R, R 2 ), Bonferroni-corrected P-values and total number of tumour samples (n) are displayed at the top.
The grey shaded band denotes the 95% confidence interval for the mean fitted response at each x-value.
( f ) Spatial coherence score (y-axis) of each ZFTA-RELA cell state/type (x-axis).
Extended Data Fig.
5 Tumour spatial distribution of cell types/states profiled by 10X Xenium.
( a ) Spatial maps of 56 ZFTA-RELA tumour sections profiled by 10X Xenium, depicting distribution of cell states/types identified for each section.
Extended Data Fig.
6 Comparison of spatial metaniches and CellCharter spatial clusters.
( a ) Overlay of 10X Xenium metaprogram assignment, CellCharter spatial clusters, and H&E staining for ependymal-rosettes (circled) in ZFTA-RELA tumour section (STEPN-12), showing correspondence of morphologically distinct local tumour region with metaprogram annotation and spatial niche assignment.
( b ) Pairwise Pearson correlation (colour scale) representing similarity in cell type composition of the spatial niches identified in 56 ZFTA-RELA tumour sections analysed by 10X Xenium.
Each row and column represent one individual spatial niche identified in one tumour section, summarized by its relative frequency of cell states/types.
Recurrent niches are highlighted by dashed line boxes.
Niches are annotated based on the most frequent cell types (displayed on the right side in the pie charts).
( c ) CellCharter spatial cluster stability (y-axis) across different number of clusters (x-axis).
Most stable clusters are marked.
All depicted data are mean values with 95% confidence interval.
( d ) Proportion barplot of spatial clusters (y-axis) present in each of 56 ZFTA-RELA tumour sections (x-axis).
( e ) Comparison of spatial niche assignment ( top ) to CellCharter spatial clusters grouped by similarity in the cell state/type most dominantly present in each cluster ( bottom ).
( f ) Correlation of cell type proportion in CellCharter spatial clusters (y-axis) and in metaniches (x-axis).
Spatial clusters identified by CellCharter are grouped based on the most abundant cell types, and cells assigned to spatial clusters of the same group are pooled to compute proportions of cell types.
Cells assigned to each recurrent niche are also pooled to compute proportions of cell types.
The correlation in cell type proportions is assessed by linear regression, where p-values are calculated from t-statistic (two-tailed test).
Each data point is a cell type.
( g ) Comparison of the entropy of sample proportions in each spatial cluster (y-axis) in tumour-abundant or tumour-microenvironment (TME)-abundant (x-axis) spatial clusters ( n = 26 spatial clusters examined).
TME-enhanced defined as total normal cell proportion >= 30%.
Statistical significance was calculated by two-sided permutation test.
Box plot shows the median (centre line), 25th–75th percentiles (bounds of the box), and whiskers extending to the minimum and maximum values within 1.5 times the interquartile range; points beyond the whiskers represent outliers.
Extended Data Fig.
7 Metaprogram gene signatures across different patient-derived models.
( a ) Graphical summary of ZFTA-RELA patient tumour cells profiled by sc/snRNA-seq derived from neurosphere ( n = 3), adherent ( n = 3), coculture with rat E19 cortical cells ( n = 3) and PDX ( n = 3) models of EP1NS, BT165 and VBT242.
The diagram in a was created using BioRender; Jeong, D.
https://BioRender.com/48ezyou (2026).
( b ) Cell state plots of ZFTA-RELA patient tumour cells profiled by sc/snRNAseq overlayed with single cells derived from neurosphere ( n = 3), adherent ( n = 3), coculture with rat E19 cortical cells ( n = 3) and PDX ( n = 3) models of EP1NS, BT165, and VBT242.
Plots are coloured by model (left) and by sample (right).
( c ) Cell state plots of ZFTA-RELA patient tumour cells profiled by sc/snRNAseq in patient, adherent (monoculture), spheroid (monoculture), coculture with rat E19 cortical cells, and PDX models.
( d ) Heatmap showing relative expression of the top 50 genes identified by NMF analysis specific to neuroepithelial-like, neuronal-like, and ependymal-like signatures.
Cells are sorted according to the overall expression of ependymal-like versus neuronal-like gene programs.
Model (patient, adherent, spheroid, coculture, or PDX), cycling status, and metaprogram assignment are indicated on the top bars.
Select genes of interest are indicated on the right.
( e ) ( top ) UMAP of ZFTA-RELA tumour cells (EP1NS-tdTomato, BT165-tdTomato, VBT242-tdTomato) cocultured with rat E19 cortical cells ( top ).
Plot is coloured by the cell type, and tumour cells are highlighted by black dotted circle.
( bottom ) Proportion (y-axis) of cell types in the right E19 cortical cells (x-axis).
( f ) Volcano plot showing genes differentially expressed between ZFTA-RELA cells in coculture versus monoculture, using two-sided Wilcoxon rank-sum test and Bonferroni-corrected.
Genes with |log2FC | > 1 and adjusted P-value < 0.001 are highlighted in colour.
( g ) Top 10 gene ontology (GO) terms enriched in genes differentially expressed (input for GO: |log2FC | > 1 and adjusted P-value < 0.001) between coculture and monoculture ZFTA-RELA cells based on the genes identified in (g).
For each GO term, enrichment p-values were computed by one-sided hypergeometric test.
Reported adjusted p-values correspond to Benjamini-Hochberg false discovery rate (FDR)-corrected p-values.
Extended Data Fig.
8 Metaprogram marker expression in patient-derived ZFTA-RELA cells cocultured with rat cortical cells.
( a ) Dot plot showing scaled mRNA expression of marker genes for each metaprogram in ZFTA-RELA patient tumours profiled by sc/snRNAseq.
Dot size represents percent expressed, while colour scale represents the average expression.
( b ) Example image of cell segmentation for ZFTA-RELA cells expressing tdTomato and S100B.
( c ) Representative immunofluorescence images of ZFTA-RELA (EP1NS cells expressing tdTomato) cells in coculture with rat E19 cortical cells ( n = 155 cells acquired from n = 3 independent biological replicates per marker).
Extended Data Fig.
9 Phenotypic characterization of cell states in ZFTA-RELA cells cocultured with rat cortical cells.
( a ) ( top row ) Immunofluorescence image of each morphological subtype of ZFTA-RELA (EP1NS cells expressing tdTomato) cocultured with rat E19 cortical cells, stained for anti-tdTomato and DAPI.
( bottom row ) Immunofluorescence image overlayed with 10X Xenium transcripts.
Each dot represents detected transcript from the custom ( n = 100) and base panel ( n = 266) probes used for patient tumour sections.
Table indicates top 5 enriched markers in demarcated region (white).
( b and c ) An exemplary migratory neuronal-like ( b ) and neuroepithelial-like ( c ) ZFTA-RELA tumour cell showing continuous migration in coculture with rat E19 cortical cells.
( d ) in vivo time-lapse imaging of PDX model of ZFTA-RELA (EP1NS cells expressing tdTomato) acquired with two-photon microscopy.
Tumour cells are indicated in red, and blood vessels in green.
An invasive cell and its invasion route (dashed arrow, above) versus a stable cell (arrowhead, below) are shown.
( e ) Different forms of TM dynamics, such as protrusion, retraction, branching and TM genesis of in vitro coculture model of ZFTA-RELA (EP1NS cells) using live-cell timelapse imaging.
Arrows indicate direction of TM movement.
Arrowhead pointing to soma, out of which a new primary TM grows.
( f ) ( left ) Net TM turnover of ZFTA-RELA cells, including protrusion and retraction, over 4 h for each morphological subtype in in vitro coculture (immature ependymal-like n = 96 cells, neuroepithelial-like-2 n = 57 cells, neuronal-like n = 51 cells).
Immature ependymal-like to neuronal-like adjusted p-value (p < 0.001) is 3.105 ×10 −9 .
( right ) Net TM turnover of ZFTA-RELA cells over 4 h for each morphological subtype in vivo (immature ependymal-like n = 36 cells, neuroepithelial-like-2 n = 27 cells, neuronal-like cells n = 37 cells).
Data points represent individual cells; overlaid bars show mean ± SEM.
Significant p-value calculated by Dunn’s multiple comparison test (one-sided) are shown.
( g ) Representative image of tdTomato labelled neuroepithelial-like-2 ZFTA-RELA cell undergoing cell division in co-culture (arrowhead pointing to mother and daughter cells).
( h ) Proportion of cells assigned as cycling or non-cycling (colour-legend) by cell states in coculture with rat E19 cortical cells (left) and PDX (right) profiled by sc/snRNA-seq.
Extended Data Fig.
10 10X scRNAseq and imaging of ZFTA-RELA cells expressing tdTomato cocultured with human iPSCs-derived neurons and astrocytes.
( a ) CNV profiles of each cell (y-axis) across chromosomal location (x-axis) inferred from scRNAseq data of EP1NS-tdT coculture with human iPSCs-derived neurons and astrocytes.
( b ) UMAP plots of all tumour ( n = 2924) and human normal cells ( n = 503), plots coloured by tumour status (left), tdTomato expression (middle), and cell annotation (right).
( c ) Proportion barplot of normal cell types present in EP1NS-tdT coculture with human iPSCs-derived neurons and astrocytes ( d ) Cell state plot showing ZFTA-RELA tumour cells profiled by scRNAseq, coloured by culture condition.
ZFTA-RELA patients profiled by sc/snRNA-seq (grey) were combined as reference for cell state hierarchy.
( e ) Representative immunofluorescence images of ZFTA-RELA cells (EP1NS) expressing tdTomato from one of n = 3 independent experiments with similar results; classified as: Nestin+ round cells without TMs (neuroepithelial-like-1, left), Nestin+ cells with 1–3 short TMs (neuroepithelial-like-2), S100B+ cells with more than 3 short TMs (immature ependymal-like, middle right), and DCX+ cells with 1–3 long TMs (neuronal-like, right).
( f ) Distinct migratory patterns depicted for each morphological subtype.
Arrowheads point to the soma.
( g ) Neuronal-like migratory patterns of ZFTA-RELA cells expressing tdTomato shown in schematic and live-cell timelapse imaging examples.
Arrows indicate direction of TM movement.
Arrowhead pointing to branching point (branching migration), cell soma (locomotion) or stable TM tip (translocation).
( h ) Cell migration speed of ZFTA-RELA cells in coculture with human iPSC-derived cells in μm per hour, determined using timelapse imaging.
Cells are categorized by morphological subtype ( n = 202 total, acquired from n = 3 independent biological replicates).
Individual data points with mean ± SE are shown.
( i ) Quantification of migratory modes across ZFTA-RELA cells classified as neuroepithelial-like-2 ( n = 18), or neuronal-like cells ( n = 22).
Supplementary Fig.
1 (download PDF )
Exemplary FACS gating strategies.
Reporting Summary (download PDF )
Supplementary Tables (download ZIP )
Peer Review file (download PDF )
Source Data Fig.
5 and Source Data Extended Data Figs.
9 and 10.
(download XLSX )
Version of record : 11 March 2026
DOI : https://doi.org/10.1038/s41586-026-10214-2
Related Stories


Source: This article was originally published by Nature News
Read Full Original Article →
Comments (0)
No comments yet. Be the first to comment!
Leave a Comment