Nature ( 2026 ) Cite this article
G-protein-coupled receptors (GPCRs) are capable of signalling through four families of G protein α subunits.
Although hundreds of nucleotide-free GPCR–G protein complex structures have been solved, the mechanism of G protein subtype selectivity remains poorly understood, with recent studies suggesting a role for dynamic nucleotide-bound intermediate states 1 , 2 .
Here we use time-resolved cryo-electron microscopy to visualize the GTP-induced activation of Gα i1 βγ and Gα 11 βγ heterotrimers bound to the neurotensin receptor 1 (NTSR1), which has been demonstrated to be highly promiscuous in G protein coupling and to possess unusual conformations in the nucleotide-free complex.
We resolve ensembles of states along the G protein activation pathway, with differences in the structures and their relative populations between Gα i1 and Gα 11 .
Structural analysis reveals a key role for several motifs, including intracellular loop 2 (ICL2) and ICL3, in stabilizing the observed intermediate states.
Our results are supported by molecular dynamics simulations and kinetic bioluminescence resonance energy transfer experiments, which reveal that the stability of these intermediate states and the signalling of various G proteins are correlated with ICL2 and ICL3 sequences.
Single-molecule fluorescence assays of GTP-induced NTSR1–G protein complex dissociation reveal that NTSR1 is liberated significantly faster from Gα 11 , consistent with the relative lack of stable Gα 11 -GTP intermediate states compared with Gα i1 .
These findings highlight that transient intermediate-state complexes along the G protein activation pathway have an important role in G protein selection that cannot be explained by nucleotide-free states alone.
The dynamic basis of G-protein recognition and activation by a GPCR
Designing allosteric modulators to change GPCR G protein subtype selectivity
Dynamic spatiotemporal determinants modulate GPCR:G protein coupling selectivity and promiscuity
GPCRs comprise a large class of more than 800 receptors in humans that detect a diverse array of stimuli 3 .
Despite their diversity in ligands, each receptor couples to a subset of only four classes of G protein (Gα i/o , Gα s , Gα q/11 and Gα 12/13 ), each with distinct downstream signalling cascades 4 .
GPCR ligands that signal through a reduced subset of endogenous partners (a phenomenon known as biased signalling or functional selectivity) have attracted attention as a means of reducing side-effects and improving the therapeutic windows of drugs 5 , 6 .
Even with several hundred structures of GPCR–G protein complexes covering most G proteins 7 , the structural mechanisms by which GPCRs select for their G proteins remain poorly understood 8 , 9 , presenting a challenge for the rational design of ligands with bespoke signalling profiles.
Recent studies suggest that G protein selectivity is not solely determined by receptor–G protein complementarity in the nucleotide-free state.
Rather, evidence points to key roles for transient intermediate states and dynamic interactions involving both G protein conformations 1 and receptor motifs, including ICL2 and the transmembrane domain 5 (TM5)–ICL3–TM6 region 2 .
NTSR1 is a receptor for neurotensin (NTS), a peptide neurotransmitter and hormone that influences diverse physiological processes 10 .
NTSR1 is a promiscuous GPCR, causing significant activation of three G protein classes, with a preference for Gα q/11 > Gα i/o ≫ Gα 12/13 (refs.
7 , 11 ).
Cryo-electron microscopy (cryo-EM) of the nucleotide-free NTSR1–G i1 complex in detergent and nanodisc revealed a canonical (C) arrangement of the receptor and G protein similar to other family A complexes and an atypical non-canonical (NC) orientation with the receptor rotated by approximately 45° (refs.
12 , 13 ).
It was proposed that the NC state is an intermediate in the GPCR–G protein association pathway that needs to convert to the C state to allow GTP binding and G protein activation 12 , although an alternative explanation suggested that the two states reflect the promiscuous G-protein coupling of NTSR1, for example by the NC NTSR1–G i1 complex, representing a trapped low-energy state that could affect the efficiency of G protein activation and thus selectivity.
Here, we use time-resolved cryo-EM to visualize multiple structures along the GTP-induced G protein activation pathway 14 , 15 for the NTSR1–G i1 and NTSR1–G 11 complexes.
Both C and the NC NTSR1–G i1 complexes are observed bound to GTP, although these are likely to have different allosteric effects on Gα.
We resolve high-resolution intermediate states of NTSR1–G i1 -GTP in which contact with G i1 is maintained largely by interactions between intracellular loop regions and the G protein heterotrimer.
By contrast, whereas C and NC conformations occur with nucleotide-free NTSR1–G 11 , once GTP is added, fewer intermediates are detected that resemble C-like complexes or have the receptor separated from G 11 .
The differences in NTSR1 intermediates with G i1 and G 11 , together with dissimilar behaviour for μ-opioid receptor (MOR)–G i1 activated by GTP 14 , lead us to hypothesize that sequence divergences in ICL2, ICL3 and the G proteins are drivers of these unique intermediates and cause G 11 release from NTSR1 upon introduction of GTP to be substantially faster than G i1 .
We demonstrate that these intermediate states are important for rationalizing signalling preferences and subtype selectivity with comparison to previously published assay data, single-molecule fluorescence assays, molecular dynamics simulations and kinetic bioluminescence resonance energy transfer (BRET) data.
Ensembles of apo and GTP-bound NTSR1–G i1
Previous studies have demonstrated that the NTSR1–G i1 complex possesses C and NC orientations (Fig.
1a ) in both detergent and nanodiscs 12 , 13 ; these complexes either included a G i1 heterotrimer-stabilizing antibody fragment or were limited to resolutions of around 4.0 Å.
To obtain a high-resolution, unbiased reference, we imaged the nucleotide-free complex of G i1 bound to human NTSR1 in the presence of NTS 8–13 peptide, which contains all of the key activating residues that occupy the ligand-binding pocket of NTSR1.
We were able to resolve three primary species: the C NTSR1–G i1 complex with an open alpha-helical domain (AHD) separated from the RAS homology domain (RHD) at 2.1 Å resolution (C-open-apo), the NC complex with an open AHD at 2.3 Å (NC-open-apo), and a third state with the G i1 AHD in a closed-like conformation with NTSR1 in the C orientation (C-closed-apo) (Fig.
1b and Extended Data Fig.
1a ).
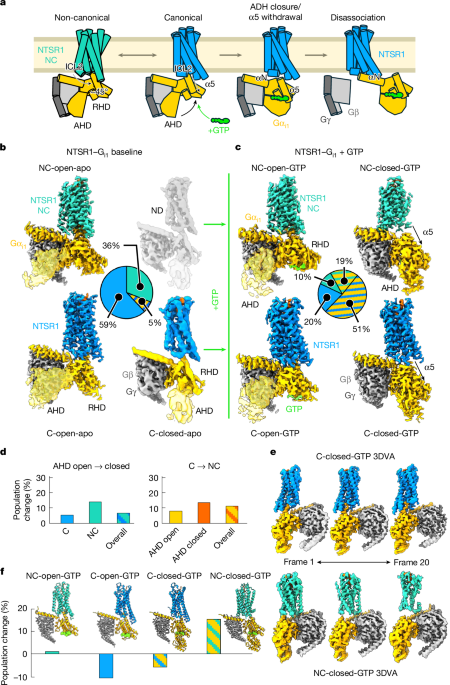
The ratio of C to NC complexes is roughly 2:1, with around 59% of the particles in the C-open-apo conformation, around 5% in the C-closed-apo conformation and around 36% in the NC-open-apo conformation (Fig.
1b ).
Fig.
1: Conformational landscape of NTSR1–G i1 activation.
a , The previously proposed model for the observed states of the NTSR1–G i1 complex, in which the NC orientation (turquoise) is an intermediate along the C G protein activation pathway (blue).
b , Cryo-EM reconstructions of the nucleotide-free NTSR1–G i1 complex with wild-type G protein, with their relative populations.
Unsharpened maps (translucent golden rod) are overlaid for the AHD to show its positioning.
ND, not determined.
c , Reconstructions from pooled 6 s and 20 s time points for GTP-induced NTSR1–G i1 activation, with their relative populations averaged over both time points.
d , The percentage change in relative particle populations from the 6 s time point to the 20 s time point; conversion from AHD open to closed (left) and from C to NC (right).
e , 3DVA results for the C-closed-GTP and NC-closed-GTP states, showing the most distal frames of the resulting 20-frame videos.
f , The percentage change in relative population from 6 s to 20 s for all four states, overlaid with a proposed model for the transition between the observed intermediate states along the GTP-induced activation pathway.
Full size image
a , The previously proposed model for the observed states of the NTSR1–G i1 complex, in which the NC orientation (turquoise) is an intermediate along the C G protein activation pathway (blue).
b , Cryo-EM reconstructions of the nucleotide-free NTSR1–G i1 complex with wild-type G protein, with their relative populations.
Unsharpened maps (translucent golden rod) are overlaid for the AHD to show its positioning.
ND, not determined.
c , Reconstructions from pooled 6 s and 20 s time points for GTP-induced NTSR1–G i1 activation, with their relative populations averaged over both time points.
d , The percentage change in relative particle populations from the 6 s time point to the 20 s time point; conversion from AHD open to closed (left) and from C to NC (right).
e , 3DVA results for the C-closed-GTP and NC-closed-GTP states, showing the most distal frames of the resulting 20-frame videos.
f , The percentage change in relative population from 6 s to 20 s for all four states, overlaid with a proposed model for the transition between the observed intermediate states along the GTP-induced activation pathway.
The high resolution of our nucleotide-free G i1 maps provide an opportunity to more precisely compare the C and NC states.
The major conclusions about the conformational changes in the two receptor states remain, with the primary difference lying in the TM7–helix 8 (H8) region, with an unusual and more inactive-like conformation of the NPXXY motif for the NC state (Extended Data Fig.
2a ).
On the basis of the cryo-EM maps, ICL2 becomes more dynamic in the NC state, probably as a result of looser packing with the G protein (Extended Data Fig.
2b ).
There are also subtle differences in the G protein, with the β6–α5 (TCAT) loop being more disordered in the C state (Extended Data Fig.
2c ).
The different ICL2 positions drive changes in the β2–β3 loop (Extended Data Fig.
2c,d ), probably resulting in the α1 helix being slightly more extended in the C state (Extended Data Fig.
2c ).
Three-dimensional variability analysis (3DVA 16 ) identifies little further heterogeneity in key activation motifs outside of transient ordering of the linker I region (Extended Data Fig.
2e ).
We could not detect any AHD closed particles with an NC receptor orientation, possibly owing to the differing allosteric effects of the receptor ICL2 region on the β2–β3 loop, α1 helix and the α5 helix (Extended Data Fig.
2c ).
To explore these effects, we performed molecular dynamics simulations starting from the open and closed AHD C and NC states, which demonstrated greater AHD dynamics in both open and closed states for the NC orientation (Extended Data Fig.
2f ), although without sampling full open–closed transitions in the timescales used, we cannot rule out other explanations for the greater AHD opening with the NC orientation receptor.
In both AHD closed states, retraction of the α5 helix leaves ICL2 and ICL3 responsible for an increased proportion of the ordered contacts between receptor and G protein (Extended Data Fig.
3d,e ).
This is particularly prominent in the NC states, in which ICL2 accounts for 75% of contacts in NC-closed-GTP compared with only 6% of contacts in the NC-open-apo structure (Extended Data Fig.
3d,e ).
In the NC-closed-GTP state, the ICL2 contacts involve F174 3 4.51 , T178 3 4.55 and R182 4.39 (in Ballesteros–Weinstein notation 17 ), Gβ and the Gα αN helix (Extended Data Fig.
3f ).
The TM5–ICL3–TM6 region of the NC-closed-GTP state is also poised with TM6 between the β2–β3 loop and the α5 helix, with ICL3 partially disordered but filtering between the β2–β3 loop and the αN helix (Extended Data Fig.
3g ).
In both C-closed-GTP and NC-closed-GTP states, despite the α5 helix occupying the retracted conformation, the tip of α5 is still observed inside an intracellular cavity of the receptor, although the first principal component of 3DVA reveals that, whereas nearly all of the C-closed-GTP particles have some degree of α5 tip engagement and a stable receptor (the two extreme states from this 3DVA denoted C-closed-GTP and C-closed*-GTP), the NC-closed-GTP particle stack contains particles in which greater α5 disengagement is correlated with a poorly resolved receptor (Fig.
1e , Extended Data Figs.
3a,h and Supplementary Videos 1 and 2 ).
The reduced α5 helix engagement and propensity for receptor dissociation in the NC-closed-GTP state suggests that this state may occur after the C-closed-GTP state—that is, further along the pathway of total complex dissociation.
To ensure that these results were not an artefact of the detergent environment, we repeated the NTSR1–G i1 6 s time point in a MSP1D1 nanodisc, enabling identification of all four states in the two-dimensional class averages (Extended Data Fig.
4a ), with a slight enrichment of particles in C conformations relative to those in NC conformations.
Further, we were able to obtain sub-3.0 Å reconstructions of the C-open-GTP and C-closed-GTP states, demonstrating nearly identical conformations to detergent (Extended Data Fig.
4b ).
In the pooled time-resolved cryo-EM data, addition of GTP substantially shifts the conformational equilibrium compared with the nucleotide-free baseline, with AHD closed conformations increasing from around 7% of particles to the predominant species at around 70% regardless of whether the receptor is C or NC (Fig.
1b,c ).
The ratio of C to NC remains roughly 2:1 for both AHD open and AHD closed states (Fig.
1c ).
By comparing the fraction of particles in each state at 6 s and 20 s, we can track the evolution of the system over time, with the first trend being the expected shift towards particles in AHD closed states as time progresses (Fig.
1d ).
Notably, we also observed a time-dependent increase in the relative populations of particles in the NC-like states, particularly NC-closed-GTP (Fig.
1d ).
This observation, together with the differing allosteric effects on AHD closure and the 3DVA result demonstrating an unstable receptor in the NC-closed-GTP particle stack, supports a model similar to the one originally proposed, in which the NC state represents an intermediate that both precedes the C state during nucleotide exchange and follows the C state during GTP-induced complex dissociation.
However, given that the NC state is still capable of binding guanine nucleotide, we cannot rule out direct NC G protein activation without a C state.
Intermediate C and NC NTSR1–G i1 states are sufficiently stable to resolve using time-resolved cryo-EM but are driven by ICL–G i heterotrimer interactions, raising the question of to what extent this ensemble of states occurs with the other G proteins and how they influence those signalling pathways.
Unique NTSR1–G 11 -GTP intermediate behaviour
To our knowledge, there are no cryo-EM structures of the nucleotide-free wild-type NTSR1–G 11 complex, and few such structures exist for any receptor.
Structure determination of G q -coupling receptors has almost exclusively used miniG q 18 , which lacks the AHD and has several other modifications 19 .
We purified sufficient nucleotide-free NTSR1–G 11 complex to obtain cryo-EM datasets, revealing similar structures to those that we observed for NTSR1–G i1 (Fig.
2a ), although with some differences.
Both C and NC orientations of the receptor exist with NTSR1–G 11 , indicating that the NC conformation is not specific to G i .
In the C orientation, we observe two major conformations of the AHD, each with substantial populations, corresponding to a relatively typical AHD open state (C-open-apo) and a second state in which the AHD is partly closed (C-P-closed-apo) (Fig.
2a ).
The difference between G proteins is likely to stem from differences in the α1 helix-linker I region between G i and G 11 .
Whereas NTSR1–G i1 exhibited varying degrees of α1 helix extension (Extended Data Fig.
2c ), α1 is fully or almost fully extended in all of the states observed for G 11 (Extended Data Fig.
5a ).
The linker I region of G 11 contains a glycine immediately following the histidine at the end of α1 (Extended Data Fig.
5b ), conferring greater flexibility to the linkage between RHD and AHD.
Kinetic BRET assays examining Gβγ release for NTSR1–G i1 and NTSR1–G q reveal that when the linker I regions are swapped between G i and G q , the kinetics of G i1 signalling are significantly impaired, whereas the similar swap onto G q marginally increased kinetics, suggestive that G i1 signalling is optimized for a sharp open–closed transition (Extended Data Fig.
5c ).
Complexes with the C orientation still outnumber those with the NC orientation, although with a slightly diminished ratio of around 1.5:1.
Even though the relative population is higher for both the NC-open-apo state and a state with some degree of closure of the AHD compared with our results for G i1 , we still do not observe any appreciable population of a NC state with any degree of AHD closure.
Fig.
2: Unique dynamics of NTSR1–G i1 versus NTSR1–G 11 activation.
a , Nucleotide-free baseline cryo-EM maps of the NTSR1–G 11 complex, with their relative populations.
b , The two states observed in time-resolved cryo-EM of the NTSR1–G 11 complex separated with three-dimensional classification.
Insets display an overlay of the maps and models for the changes in the switch II (Sw II) and switch III (Sw III) regions.
c , Comparison of the NTSR1–G i1 and NTSR1–G 11 C-closed-GTP state, highlighting the rotation of the receptor and slight repositioning of ICL2.
d , Alignment of the structure of G 11 with the NTSR1 NC-closed-GTP complex on the αN helix and RHD, highlighting likely unfavourable interactions in a hypothetical NTSR1–G 11 NC-closed-GTP complex.
e , Biotinylated Tris-Ni 2+ -NTA-immobilized, nucleotide-free complexes of NTSR1 bound to either G i1 or G 11 were subjected to pre-steady state addition (at t = 1 s) of imaging buffer with or without 1 mM GTP.
The loss of labelled NTSR1 molecules from surface-immobilized G protein complexes were fit with either one (for buffer only) or three (for buffer with GTP) exponential functions.
Plotted data represent mean (lines) and s.d.
(shaded areas) from two independent repeats.
Full size image
a , Nucleotide-free baseline cryo-EM maps of the NTSR1–G 11 complex, with their relative populations.
b , The two states observed in time-resolved cryo-EM of the NTSR1–G 11 complex separated with three-dimensional classification.
Insets display an overlay of the maps and models for the changes in the switch II (Sw II) and switch III (Sw III) regions.
c , Comparison of the NTSR1–G i1 and NTSR1–G 11 C-closed-GTP state, highlighting the rotation of the receptor and slight repositioning of ICL2.
d , Alignment of the structure of G 11 with the NTSR1 NC-closed-GTP complex on the αN helix and RHD, highlighting likely unfavourable interactions in a hypothetical NTSR1–G 11 NC-closed-GTP complex.
e , Biotinylated Tris-Ni 2+ -NTA-immobilized, nucleotide-free complexes of NTSR1 bound to either G i1 or G 11 were subjected to pre-steady state addition (at t = 1 s) of imaging buffer with or without 1 mM GTP.
The loss of labelled NTSR1 molecules from surface-immobilized G protein complexes were fit with either one (for buffer only) or three (for buffer with GTP) exponential functions.
Plotted data represent mean (lines) and s.d.
(shaded areas) from two independent repeats.
The orientation of NTSR1 differs slightly between the C-closed-GTP states of G i1 and G 11 , with subtle effects on G protein engagement.
ICL2 still engages the cleft between the β2–β3 loop and the α5 helix of G 11 , with F174 34.51 inserted into a hydrophobic region, but several key residues in the cleft are substituted (noticeably, the β2–β3 loop K192 of G i1 is swapped for E197 of G 11 ).
ICL2 (and thus the entirety of NTSR1) is rotated by approximately 10° in G 11 -C-closed-GTP compared with G i1 -C-closed-GTP (Fig.
2c ), which is necessary to avoid a steric clash and/or unfavourable electrostatic interactions with the αN R37 of G 11 (corresponding to A31 of G i1 ; Extended Data Fig.
6d ).
The percentage of contacts between NTSR1 ICL2 and G 11 again increases substantially from the C-open-apo to the C-closed-GTP state, from 21% to 44%, suggesting a role for ICL2 remains in G 11 interaction (Extended Data Fig.
6e,f ).
We aligned the Gα 11 subunit to the NC-closed-GTP state observed with G i1 to explore why such an intermediate is absent in the presence of GTP for G 11 (Fig.
2d ).
One potential roadblock is a lysine residue (K33 of Gα 11 ; G27 of Gα i1 ) which would extend towards the ICL2 lysine K177 34.54 of the receptor in the NC orientation (Fig.
2d ), generating an unfavourable electrostatic interaction.
The αN–β2–β3 loop–α5 region that TM5–ICL3–TM6 threads through in this orientation also bears substantial differences in sequence between G proteins (Fig.
2d and Extended Data Fig.
6g ), although it is difficult to pinpoint unfavourable residues without a resolved structure.
More broadly, comparing sequences in intermediate-state receptor-binding G protein regions reveals substantially greater sequence variation between major subtype families compared with members of the same subtype, highlighting the potential for these regions to more generally drive the stability of GPCR–G protein intermediate states and coupling selectivity (Extended Data Fig.
6h ), which is supported by previous bioinformatics and FRET (Förster resonance energy transfer) work 22 , 23 .
Given the comparative lack of stable intermediate states with G 11 compared to G i1 in the GTP activation pathway, it would seem likely that activated G 11 release from NTSR1 is significantly faster than G i1 , and that this is an important component of the higher levels of G 11 signalling compared with G i1 observed in assays.
To probe this, we performed pre-steady-state single-molecule fluorescence-based experiments of GTP-induced NTSR1–G protein complex activation.
In brief, a nucleotide-free complex of fluorescently labelled NTSR1 and either G i1 or G 11 was tethered to a microfluidic device (Fig.
2e and Methods ).
At low illumination intensity, GTP induced the dissociation of NTSR1–G i1 and NTSR1–G 11 complexes with time constants of around 37 s and 15 s, respectively, approximately 2.5 times slower for G i1 release compared with G 11 (Fig.
2e and Supplementary Table 1 ).
These findings corroborate time-resolved cryo-EM analysis in which NTSR1–G i1 complexes undergo GTP-induced dissociation through more stable intermediate conformations than NTSR1–G 11 complexes.
Four NTSR1 residues that are thought to be involved in interactions with G i1 in the NC, but not C, nucleotide-free complex (S93 and L94 in ICL1, R294 6.26 at the base of TM6, and H373 8.52 in H8) were previously demonstrated with mutagenesis to be able to selectively reduce G i1 signalling compared with G q 12 .
Given that both C and NC states exist for the NTSR1–G 11 nucleotide-free complex, it is worth considering how this G protein selectivity is being conveyed.
The interaction between R294 6.26 and the α5 helix occurs in both G i1 and G 11 NC nucleotide-free G protein complexes (Extended Data Fig.
7a ), whereas ICL1 is largely dynamic in both the G 11 -NC-open-apo and G i1 -NC-open-apo state maps (Extended Data Fig.
7b ).
There is no interaction between G 11 and the receptor H8 H373 8.52 in the G 11 -NC-open-apo state (Extended Data Fig.
7a ); this interaction is not well-resolved in our G i1 -NC-open-apo structure (Extended Data Fig.
7c ) and the interaction is long for a strong hydrogen bond in the previously reported Protein Data Bank (PDB) structure 6OSA 12 .
Thus it would seem unlikely these mutations selectively knock out the NC-open-apo state of G i1 and not that of G 11 .
Some of the selectivity of these mutations is better rationalized by considering the intermediate states; for example, R294 6.26 of NTSR1 in the G i1 -C-closed-GTP state is pointing towards the retracted α5 helix and can be modelled into residual map features forming a salt bridge with D350 on the α5 helix (Extended Data Fig.
7d,f ).
By contrast, owing to the rotation of NTSR1 in the G 11 -C-closed-GTP state compared with the G i1 -C-closed-GTP state, R294 6.26 is moved almost 5 Å away from the α5 helix and is thus unlikely to be interacting with the G 11 E353 that is equivalent to G i1 D350 (Extended Data Fig.
7e ).
It is worth noting that for muscarinic acetylcholine receptors (mAChRs), interactions between TM5–TM6 and the α5 helix alone can differentiate between G i - and G q -coupled mAChRs 24 .
The α5 helix sequence, including the terminal hook, having a role in G protein subtype selectivity is an even more broadly observed phenomenon 25 , 26 , 27 .
By capturing the AHD closed intermediates, we gain additional insights into how the α5 helix hook samples the intracellular GPCR cavity when the α5 helix is in the retracted position.
In contrast to the nucleotide-free state, the cryo-EM maps suggest that ICL1 may be more involved in interacting with G i1 in the C GTP-bound intermediate than the NC (Extended Data Fig.
7g ).
Thus, our time-resolved cryo-EM data reveal that these mutations probably do not uniquely discriminate between C- and NC-like states, but can help rationalize their effects on G i1 versus G 11 signalling.
Intermediates influence G protein selectivity
To explore how other GPCR–G protein activation intermediates may influence G protein selectivity, we compared our NTSR1 results to previous work that examined GTP-induced activation of the MOR–G i1 complex 14 , which reveals similarities and differences in the intermediate states observed and their apparent stabilities (Fig.
3a and Extended Data Fig.
6a ).
Two high-population intermediate states exist for NTSR1–G i1 with a closed AHD, withdrawn α5 helix and active-conformation receptor (Fig.
3b ).
By contrast, only a small fraction of the MOR–G i1 particles (when bound to an equivalently strong agonist such as NTS 8–13 ) 28 , 29 are resolved with both a closed AHD and active receptor (G-ACT-1; Fig.
3a ), and only with minimal α5 helix withdrawal and incomplete AHD closure (Extended Data Fig.
8a ).
Rather, full, and particularly superagonist-bound, MOR–G i1 has almost complete disengagement of the receptor from the G protein once the AHD fully closes (Fig.
3a and Extended Data Fig.
8a ), with a pseudo-stable MOR–G i1 AHD closed complex only occurring with partial agonists that have collapsed back to the inactive receptor conformation (Extended Data Fig.
8b ).
Fig.
3: Contrasting intermediate states of MOR–G i1 versus NTSR1–G i1 GTP-induced activation.
a , Populations and structures for the intermediate states observed in the GTP-induced activation of the MOR–G i1 –lofentanil complex.
b , Populations and structures for the intermediate states observed in the GTP-induced activation of the NTSR1–G i1 complex.
c , Sequences of the NTSR1 and MOR ICL2 region and alignment of the active-state receptor structure of MOR (green) with the C-closed-GTP state of NTSR1, highlighting ICL2 differences.
d , Alignment of the active-state receptor structure of MOR with the NC-closed-GTP state of NTSR1, highlighting the C-closed-GTP state of NTSR1 and differences in ICL2.
e , Alignment of the active-state receptor structure of MOR with the NC-closed-GTP state of NTSR1, highlighting the C-closed-GTP state of NTSR1 and differences in TM5–ICL3–TM6, together with the sequence of the TM5 and TM6 regions of NTSR1 and MOR.
Full size image
a , Populations and structures for the intermediate states observed in the GTP-induced activation of the MOR–G i1 –lofentanil complex.
b , Populations and structures for the intermediate states observed in the GTP-induced activation of the NTSR1–G i1 complex.
c , Sequences of the NTSR1 and MOR ICL2 region and alignment of the active-state receptor structure of MOR (green) with the C-closed-GTP state of NTSR1, highlighting ICL2 differences.
d , Alignment of the active-state receptor structure of MOR with the NC-closed-GTP state of NTSR1, highlighting the C-closed-GTP state of NTSR1 and differences in ICL2.
e , Alignment of the active-state receptor structure of MOR with the NC-closed-GTP state of NTSR1, highlighting the C-closed-GTP state of NTSR1 and differences in TM5–ICL3–TM6, together with the sequence of the TM5 and TM6 regions of NTSR1 and MOR.
By aligning the active structure of MOR to the G i1 -C-closed-GTP and G i1 -NC-closed-GTP structures for NTSR1 (Fig.
3c,d ), we can identify several key residue changes mainly centred on ICL2 that would destabilize similar intermediates with MOR.
Substitution of the ICL2 F174 34.51 of NTSR1 for V175 34.51 would reduce hydrophobic packing in both states (Fig.
3c,d ), and for the C-closed-GTP state would probably modulate the allosteric effect on the α1–β2–β3 loop–α5 region (Fig.
3c ).
This may contribute to intrinsic differences in AHD opening between NTSR1–G i1 and MOR–G i1 , as NTSR1–G i1 possesses a higher propensity for AHD closure 14 (Fig.
3a and Extended Data Fig.
8c ).
D179 34.55 of the MOR ICL2 (T178 34.55 in NTSR1) would be positioned near D193 of G i1 in a hypothetical G i1 -C-closed-GTP intermediate state, producing unfavourable charge–charge repulsion (Fig.
3c ).
Finally, a G i1 -NC-closed-GTP state with MOR would be incapable of forming the interaction between the TM5–ICL3–TM6 of the receptor and the αN–β2–β3 loop–α5 of G i1 given the substantially shorter TM5 of MOR (Fig.
3e ).
Molecular dynamics simulations of the G i1 -NC-closed-GTP state performed with both NTSR1 and with the receptor replaced by MOR revealed that the G i1 -NC-closed-GTP NTSR1 state is stable over multiple 2 μs trajectories, but a hypothetical G i1 -NC-closed-GTP MOR complex undergoes rotation of the receptor back towards a more C-like arrangement (Fig.
4a ).
Simulating the G i1 -C-closed-GTP complex again reveals that with NTSR1 the complex is stable over 2 μs, as is the MOR–G i1 -C-closed-GTP complex, although MOR has on average 3–4 Å longer ICL2–β2–β3 loop distances, despite the smaller sidechain of V175 34.51 compared to the equivalent F174 34.51 (Extended Data Fig.
8e ).
In summary, two relatively stable intermediate complexes with G i1 are observed with active NTSR1 but not MOR, probably because of differences in ICL2.
Fig.
4: Intracellular loops 2 and 3 guide the formation of specific intermediate states.
a , Molecular dynamics simulation results from n = 5 independent runs for the NTSR1–G i1 NC-closed-GTP structure (turquoise traces) and the equivalent complex with MOR (green traces).
The distances between ICL2 and the β2–β3 loop (left) and between ICL3 and the α4 helix (right) are used as a metric for whether the complex resembles the C-closed-GTP or NC-closed-GTP state.
b , Cartoon of the kinetic bioluminescence resonance energy transfer (BRET) assay design.
c , Kinetic BRET traces for the NTSR1 and MOR constructs tested in this work.
WT, wild type.
d , Heat maps of kinetic BRET assay results examining G i and G q signalling for NTSR1 and MOR with ICL2 and/or ICL3 swapped.
Experiments were performed with three (NTSR1) or four (MOR) independent experiments with four technical replicates each.
e , Cartoon of the ICL2 point mutation locations and heat maps of kinetic BRET assay results examining G i and G q signalling for NTSR1 ICL2 point mutants.
Experiments were performed with three (NTSR1) or four (MOR) independent experiments with four technical replicates each.
Full size image
a , Molecular dynamics simulation results from n = 5 independent runs for the NTSR1–G i1 NC-closed-GTP structure (turquoise traces) and the equivalent complex with MOR (green traces).
The distances between ICL2 and the β2–β3 loop (left) and between ICL3 and the α4 helix (right) are used as a metric for whether the complex resembles the C-closed-GTP or NC-closed-GTP state.
b , Cartoon of the kinetic bioluminescence resonance energy transfer (BRET) assay design.
c , Kinetic BRET traces for the NTSR1 and MOR constructs tested in this work.
WT, wild type.
d , Heat maps of kinetic BRET assay results examining G i and G q signalling for NTSR1 and MOR with ICL2 and/or ICL3 swapped.
Experiments were performed with three (NTSR1) or four (MOR) independent experiments with four technical replicates each.
e , Cartoon of the ICL2 point mutation locations and heat maps of kinetic BRET assay results examining G i and G q signalling for NTSR1 ICL2 point mutants.
Experiments were performed with three (NTSR1) or four (MOR) independent experiments with four technical replicates each.
It has been reported for several family A GPCRs that ICL2 and ICL3 sequences contribute substantially to G protein subtype selectivity 30 , 31 , 32 , 33 , 34 , which together with of our structural results highlight these regions as areas for study with mutagenesis.
We generated ICL2 and ICL3 chimeric constructs between NTSR1 and MOR for testing in BRET assays of agonist-induced Gβγ release (Fig.
4b ).
Given our time-resolved cryo-EM results, we hypothesize that swapping ICL2 and the TM5–ICL3–TM6 region of NTSR1 with MOR would inhibit the ability of NTSR1 to form C-closed-GTP and NC-closed-GTP states.
This should produce an outsized effect on signalling, despite both receptors canonically coupling strongly to G i and the nucleotide-free structures suggesting relatively small effects of ICL swaps (Extended Data Fig.
8d ).
Consistent with this hypothesis, maximum Gβγ release was significantly degraded with NTSR1 MOR-ICL2 compared with wild-type NTSR1 (Fig.
4b ), and the ICL2 swaps slowed the kinetics of G i –Gβγ release for both receptors by around 50% (Fig.
4c,d ).
The effect of NTSR1 MOR-ICL2 on G q maximum Gβγ release was similar to results for G i (approximately 50% reduction in both cases); however, kinetics of G q signalling were substantially more affected, with an approximately 82% reduction.
By contrast, the NTSR1 MOR-ICL3 swap had less of an effect on G i –Gβγ release kinetics than NTSR1 MOR-ICL2 , although there was a similar effect on maximum activation, and was even less impactful on G q signalling (Fig.
4c,d ).
These effects are consistent with a major role for ICL2 contact-driven intermediate states in signalling.
Notably, swapping both ICLs of NTSR1 with those of MOR (NTSR MOR-ICL2/3 ) almost completely knock out G q signalling while retaining some level of Gβγ release for G i (Fig.
4c,d ).
However, MOR with both NTSR1 ICLs (MOR NTSR1-ICL2/3 ) did not induce G q signalling (Extended Data Fig.
8f ), highlighting that other regions, including the TM7–H8 interface, have a role in signalling, and contrasting with recent work demonstrating that the introduction of ICL2 from a GPCR that couples only to G q is sufficient to introduce some G q activation to MOR 33 .
Together with our analysis of the quadruple mutants that selectively knock out NTSR1–G i1 signalling, these results highlight that the nucleotide-free state alone does not capture many salient features for G protein selectivity.
We also tested point mutations of several of NTSR1 ICL2 residues (F174 34.51 L/V, F174 34.51 V, K177 34.54 L and T178 34.55 D) either to the corresponding residue from MOR or other common residues from family A GPCRs (Fig.
4e ).
F174 34.51 L and F174 34.51 V had little negative effect on the maximal signalling through G q , and only F174 34.51 V slowed G q kinetics, whereas maximal signalling was impaired at G i1 with F174 34.51 V, consistent with the proposed importance for the position 34.51 hydrophobic packing observed in the G i1 closed intermediate states.
The K177 34.54 L mutation substantially impaired the maximal signalling of both G proteins, but sped up G i1 signalling kinetics, whereas T178 34.55 D mildly impaired kinetics and maximal signalling for both G proteins.
Analysis of ICL2 sequences for receptors that couple exclusively to G i/o or G q/11 , or primarily couple to both (Extended Data Fig.
8g ), shows sequence biases consistent with the assay results and structural data.
G i -exclusive receptors have a strong tendency towards valine in position 34.51 (32% of receptors) and absence of phenylalanine (2%, a single receptor), whereas no G q or G i /G q receptors have a valine at 34.51, with phenylalanine present in 10% of G q receptors and 25% of G i /G q receptors (it has also been reported that for many G s -coupled receptors, Y or F is required in this position 34 ).
The 34.54 position also has a strong bias towards a cationic residue in G i /G q receptors (58%) and G q receptors (30%) but not in G i receptors (11%).
This agrees with prior work with a primary G i -coupled receptor (muscarinic receptor M 2 R), where valine at 34.51 was dispensable for signalling and could be mutated to alanine with minimal effect, but where a bulky hydrophobic 34.51 residue was more important for secondary G i coupling 35 .
These results provide a more granular view of how ICL2 influences G protein subtype selectivity, although a more complete picture will probably require additional visualization of the G protein association pathway and/or assays that uniquely probe association and dissociation separately.
Here we use time-resolved cryo-EM to reveal several distinct intermediate states for GTP-induced activation of the NTSR1–G protein complex for members of two different families of G proteins.
These results shed light on the role of the NC orientation of NTSR1–G protein complexes and demonstrate that they are capable of binding to GTP.
We further demonstrate that GTP-induced release of G 11 occurs much more rapidly compared with G i1 , with far fewer resolvable intermediate states.
This significant rate difference in the release of GTP-bound G protein is likely to be a major contributing factor to the more efficient activation of G q/11 G proteins by NTSR1 compared with G i/o 7 , 11 , emphasizing the importance of the full cycle of association–nucleotide exchange–dissociation in signalling kinetics.
These results suggest several future avenues for building on the present work to allow a more complete understanding of NTSR1 signalling and G protein subtype selection.
Full characterization of NTSR1–G protein coupling will require visualization with time-resolved cryo-EM of NTSR1 interacting with its GDP-bound G protein partners to form complex and release nucleotide, as there are likely to be substantial similarities but also subtle differences in the association and dissociation pathways.
Building on these structures, biochemical and biophysical methods for probing the conformational ensemble of GPCR–G protein complexes, including double electron–electron resonance (DEER) 37 and single-molecule FRET 38 , together with approaches such as the single-molecule fluorescence assays leveraged here, can probe the kinetics of each step of the signalling process and measure the lifetimes of specific intermediates, resolving questions of which states correspond to rate-limiting steps.
Together with molecular dynamics simulations 39 and machine learning methods, this can enable the determination of full free energy landscapes for signalling and show how the energy landscape is perturbed by different G protein signalling partners and different ligands bound to the receptor.
These insights will provide the necessary structures and dynamic information to guide the design of GPCR ligands with precise functional selectivity profiles, allosteric modulators and intracellular ‘glue’ compounds 40 , 41 , 42 , 43 , 44 , and other next-generation molecules that will significantly facilitate the production of improved GPCR drugs.
Expression and purification of G protein heterotrimer
G protein heterotrimer was expressed as described 14 in Tni cells (Expression Systems; isolated from Trichoplusia ni ; no validation or mycoplasma testing) with viruses for Gα, Gβγ and Ric-8a and snap frozen in liquid nitrogen for later use.
To purify wild-type G protein, cell pellets were thawed and resuspended in a lysis buffer containing 20 mM HEPES pH 7.5, 1 mM EDTA, 5% glycerol, 1 mM MgCl 2 , 5 mM β-mercaptoethanol, 100 µM GDP, Pierce Universal Nuclease, and protease inhibitor cocktail, and gently stirred for 30 min at 4 °C.
The lysate was then subjected to ultracentrifugation at 100,000 g for 35 min, and the supernatant was discarded.
Pellets were resuspended in solubilization buffer containing 20 mM HEPES pH 7.5, 100 mM NaCl, 1% sodium cholate, 5% glycerol, 1 mM MgCl 2 , 5 mM β-mercaptoethanol, 100 µM GDP, Pierce Universal Nuclease, and protease inhibitor cocktail, and allowed to gently stir for 1 h at 4 °C prior to ultracentrifugation at 100,000 g for 35 min.
Solubilized protein was supplemented with 30 mM imidazole and incubated for 1 h with Ni-NTA beads.
The beads were collected by centrifugation at 300 g , packed into a column, and washed with 10 column volumes of a series of buffers containing 30 mM imidazole and 50% solubilization/50% E2 buffer, 25% solubilization/75% E2 buffer, 12.5% solubilization/87.5% E2 buffer, and 100% E2 buffer (E2 buffer contained 20 mM HEPES pH 7.5, 100 mM NaCl, 5% glycerol, 1 mM MgCl 2 , 5 mM β-mercaptoethanol, 100 µM GDP, and 0.05% lauryl maltose neopentyl glycol (LMNG)/0.005% cholesterol hemisuccinate (CHS)).
Protein was eluted with 3 column volumes of buffer containing E2 buffer and 250 mM imidazole, and was incubated with 1 mg of 3C protease per 50 mg of protein with overnight dialysis at 4 °C in dialysis tubing.
The next day, the Ni-NTA column was washed with 10 column volumes of buffer containing E2 and 30 mM imidazole, and overnight cleavage was loaded over the nickel and flow through was collected.
The column was washed with an additional 2 column volumes of the E2 buffer and 30 mM imidazole, and flow through was collected.
Protein was concentrated subjected to size-exclusion chromatography with a Superdex 200 column and a buffer containing 20 mM HEPES pH 7.5, 100 mM NaCl, 5% glycerol, 1 mM MgCl 2 , 100 µM TCEP ((Tris(2-carboxyethyl)phosphine)), 20 µM GDP, and 0.01% LMNG/0.001% CHS.
Fractions were pooled, concentrated, and snap frozen in liquid nitrogen for later usage.
For single-molecule experiments instead of cutting the His tag and performing reverse chromatography, the purified G protein heterotrimers were then mixed with biotinylated Tris-NTA (Sigma, supplemented with equimolar NiCl 2 ) at a molar ratio of 2:3 and incubated on ice for 1 h.
The G protein heterotrimer and biotinylated Tris-Ni 2+ -NTA complexes were subsequently purified using size-exclusion chromatography (Superdex200, Cytiva).
Expression and purification of NTSR1
Pellets containing NTSR1 were expressed in Sf9 cells (Expression Systems, no validation or mycoplasma testing) with the baculovirus system as described 12 and snap frozen in liquid nitrogen for storage.
To purify NTSR1, cell pellets were thawed and lysed in hypotonic lysis buffer containing 10 mM HEPES pH 7.5, 1 mM benzamidine, Pierce Universal Nuclease, protease inhibitor cocktail, 1 mM EDTA, 1 mM MgCl 2 , and 100 µM TCEP, and gently stirred for 1 h at 4 °C.
Subsequently, membranes were collected by ultracentrifugation at 100,000 g , the supernatant was discarded, and pellets containing the membranes were resuspended in solubilization buffer containing 20 mM HEPES pH 7.5, 500 mM NaCl, 1 mM benzamidine, Pierce Universal Nuclease, 1 mM MgCl 2 , 100 µM TCEP, and protease inhibitor cocktail.
Detergent was then added dropwise while gently stirring at 4 °C to a final concentration of 1% LMNG/0.1% CHS/0.1% sodium cholate.
After 3 h of stirring, insoluble debris was removed via ultracentrifugation at 100,000 g , supplemented with 20 mM imidazole, and loaded over a TALON resin column.
The columns were washed with 10 column volumes of buffer containing 20 mM HEPES pH 7.5, 20 mM imidazole, 500 mM NaCl, and 0.1% LMNG/0.01% CHS.
Protein was eluted with 2 column volumes of buffer containing 20 mM HEPES pH 7.5, 250 mM imidazole, 250 mM NaCl, 10% glycerol, and 0.01% LMNG/0.001% CHS.
Purified receptor was concentrated and subjected to size-exclusion chromatography with a Superdex 200 column and a buffer containing 100 mM NaCl, 20 mM HEPES pH 7.5, 5% glycerol, and 0.01% LMNG/0.001% CHS.
Peak fractions were pooled, concentrated, and further supplemented with 5% glycerol, then snap frozen for use for complexation.
Formation and purification of NTSR1–G protein complex
Complex formation was initiated by mixing NTS 8–13 -bound receptor (NTSR1 incubated with NTS 8–13 for 1 h) with a ~1.25 molar excess of G protein and incubating for 1 h on ice before addition of apyrase to remove GDP and HRV 3C protease to cleave the GFP tag from NTSR1 and incubation on ice overnight.
Complex was then diluted in a buffer containing 100 mM NaCl, 20 mM HEPES pH 7.5, 10 μM NTS 8–13 , 0.01% LMNG/0.001% CHS, 5 mM CaCl 2 and loaded onto M1 Flag resin, washed with a buffer of 100 mM NaCl, 20 mM HEPES pH 7.5, 10 μM NTS 8–13 , 0.005% LMNG/0.0005% CHS, 5 mM CaCl 2 to remove excess G protein.
NTSR1–G protein complex, and then eluted with a buffer of 100 mM NaCl, 20 mM HEPES pH 7.5, 10 μM NTS 8–13 , 0.005% LMNG/0.0005% CHS, 200 μg ml −1 Flag peptide and 1 mM EDTA.
Eluted complex was concentrated and loaded onto a Superdex 200 size-exclusion column in a buffer of 100 mM NaCl, 20 mM HEPES pH 7.5, 10 μM NTS 8–13 , 0.001% LMNG/0.00033% GDN/0.0001% CHS, 2 mM MgCl 2 .
Fractions of complex were concentrated to 6–10 mg ml −1 for cryo-EM studies.
Preparation of NTSR1–G protein complex in nanodisc
NTSR1–G i1 complex was formed overnight as described in detergent, and then incubated for 1 h with solution containing MSP1D1 belt protein (Sigma) mixed with 3:2 POPC (1-palmitoyl-2-oleoyl- sn -glycero-3-phosphocholine):POPG (1-palmitoyl-2-oleoylphosphatidylglycerol) at a 1:5:400 ratio of complex:MSP1D1:lipid.
Two 1 h incubations with Bio-Beads SM-2 were performed followed by a final 8 h incubation with fresh Bio-Beads SM-2.
NTSR1–G protein complex was then further purified as described for the detergent complex with Flag and size-exclusion chromatography, but in the absence of detergent.
Nanodisc formation was confirmed with SDS–PAGE and concentrated to 2–4 mg ml −1 for cryo-EM studies.
Cryo-EM sample preparation and data collection
UltrAufoil R1.2/1.3 300 mesh grids were glow discharged in a Pelco unit for 45 s at 10 mA before being used for grid freezing.
3 μl of sample was pipetted onto a grid in a vitrobot held at 100% humidity and 4 °C, 0.3 μl of 10 mM GTP was added for the time-resolved cryo-EM grids, and the grids were blotted and plunge frozen in liquid ethane with a preprogramed blot and wait time to achieve 6 s and 20 s time points, chosen based upon prior studies with β 2 AR and MOR and consistent with the lifetimes observed in single-molecule based fluorescence assays.
Detergent data were collected on a G4 Titan Krios equipped with a K3 direct electron detector and a Bioquantum energy filter.
Details of each data collection can be found in Extended Data Tables 1 and 2 and Supplementary Table 2 , but in brief, grids were imaged with a nominal defocus range from −0.6 to −1.6 μm and a target dose of 55 e − Å −2 over 40 total frames in super-resolution mode.
Nanodisc data were collected on a G3 Titan Krios equipped with a Falcion IV/Selectris energy filter, with similar parameters to the detergent datasets.
All data were processed in cryoSPARC 45 .
Raw videos were aligned with patch motion correction and contrast transfer function (CTF) estimation was performed with patch CTF estimation.
Particle picking was performed with template-based picking using templates for GPCR–G protein complexes.
Extracted particles were subjected to two-dimensional classification to remove noise particles.
Further cleaning was performed with iterative rounds of ab initio model generation with multiple classes and heterogeneous refinement.
Once particle stacks were largely free of junk particles, non-uniform refinement was applied to obtain reconstructions.
3DVA was run on these reconstructions to probe for further heterogeneity, and the first principal component analysed.
Final reconstructions came from non-uniform refinement, in cases of particularly high-resolution maps CTF refinement and reference-based motion correction were performed.
In the case of the G i1 NC-open-apo and G i NC-open-GTP states, manual sharpening and preferred orientation correction, respectively, were applied to improve the map quality.
Particle counts for comparing results were based upon the pre-orientation filtering numbers.
A graphic example of the processing for the major experiments performed in this work is provided in Extended Data Fig.
1 .
Consistent with prior time-resolved cryo-EM studies of GPCR–G protein complexes, data from individual time points was merged to boost the resolution of reconstructions, and assessment of the time point-related changes in populations were based on whether particles contributing to final reconstructions came form 6 s or 20 s micrographs, although analysis of the individual time point data separately provided similar results (Extended Data Fig.
1d ).
The prior cryo-EM structures of NTSR1–G i1 were docked for all initial complex structures (PDB: 6OSA and 6OS9 ) 12 , while the G i AHD closed state was docked from the prior MOR–G i1 time-resolved work (PDB: 9ODL ).
Initial structures for G 11 were obtained from crystal structures of the G 11 heterotrimer (PDB: 8QEH ) 46 .
Manual model building was performed in Coot 47 with refinement in Phenix 48 .
Details of cryo-EM map and model refinement are found in Extended Data Tables 1 and 2 .
Euler angle distribution plots, FSC curves, local resolution plots, and selected map–model agreement panels are provided in Extended Data Figs.
7 and 8 and Supplementary Figs.
1 and 2 .
Molecular dynamics simulations and analysis
GPCR–G protein complexes were prepared by extending the N-terminus of Gα, the C-terminus of the receptor, and the C-terminus of Gγ to add enough residues to include their sites of lipidation (if not already modelled) by using residual low-resolution map features for that respective state.
The PPM webserver 47 was used to orient systems which were then solvated in a box of POPC/CHS at a concentration of ~5% CHS (chosen to provide the presence of this important signalling molecule without significantly perturbing the bulk bilayer properties), TIP3P water 49 , 100 mM NaCl, and 15 mM MgCl 2 using the CHARMM-GUI 50 .
Simulations were performed in NAMD 51 with the CHARMM36 forcefield 52 , 53 , 54 using a Langevin thermostat and Nose-Hoover Langevin piston barostat at 1 atm with a period of 150 fs and decay of 75 fs.
Periodic boundary conditions were used with nonbonded interaction smoothing at 10 Å to 12 Å with long-range interactions handled with particle mesh Ewald.
A 2 fs timestep was employed with SHAKE and SETTLE algorithms used.
All non-hydrogen, non-water/ion atoms were restrained with harmonic restraints of 1 kcal mol −1 Å −2 and the systems were minimized for 1,500 steps before gradual heating from 0 to 303.15 K in 20 K increments with 0.4 ns of simulation per increment, with an additional 10 ns of equilibration at 303.15 K.
A further 10 ns of equilibration with harmonic restraints only applied to non-hydrogen protein atoms were performed, followed by another 10 ns of equilibration with harmonic restraints only applied to Cα atoms.
The first 30 ns of unrestrained simulation was discarded from averaging as equilibration, with the following simulation considered production.
All simulations were run with 5 replicates with different initial seeds for random assignment of velocities.
VMD 55 and Python scripting were employed for analysis.
Distances for ICL2–β2–β3 were calculated from the centre of mass of residue F174 for NTSR1 and V175 for MOR and K192 of G i1 , while TM6-α4 distances were calculated based upon residue 6.26 in Ballesteros–Weinstein notation and residue D309 of G i1 .
AHD–RHD distances were calculated based on the centre of mass of the two domains.
HEK 293 cells (ATCC, revalidated by STR and mycoplasma negative) were transfected in 6-well plates with plasmids encoding a GPCR (NTSR1, MOR or variants), Gα subunit (Gα i1 or Gα q ), Venus1-155Gγ2, Venus155-239Gβ1 and memGRKct-Nluc at a ratio of 1:0.8:0.4:0.4:0.1 μg per well using linear PEI.
For activation of G q heterotrimers PTX-S1 (0.2 μg) was also transfected to prevent activation of endogenous G i /o heterotrimers.
For activation of G i/o heterotrimers 1 μM YM-254890 was added to prevent activation of endogenous G q heterotrimers.
Kinetic BRET assays were performed 24 h after transfection using a BMG Lumistar plate reader equipped for simultaneous measurement of donor and acceptor emission.
Cells were resuspended in DPBS containing 5 μM furimazine, and NTS 8–13 (1 μM final concentration) or DAMGO (10 μM) were injected after collecting a 10 s baseline.
NTSR1 assays were performed in triplicate with technical quadruplicates while MOR assays were performed in quadruplicate with technical quadruplicates.
ICL2 swaps exchanged the nine residues from 34.51 to 4.39 while ICL3 swaps exchanged the residues from 5.68 to 6.25.
Fluorophore labelling of wild-type NTSR1
Purified wild-type NTSR1 was mixed with iodoacetamide-derivatized LD555 (custom synthesis by Lumidyne technologies) at a molar ratio of 1:0.3 and incubated at room temperature for 1 h.
The labelling reaction was quenched by L -cysteine (10 mM).
The excess dye was removed by purifying the labelled NTSR1 on a G50 desalting column (2 ml).
Single-molecule fluorescence experiments
Single-molecule imaging experiments were performed using a custom-built prism-based total internal reflection fluorescence microscope, as described 56 .
The single-imaging platform used is based upon a Nikon Ti2 inverted microscope equipped with sCMOS cameras (Kinetix; Teledyne Vision Solutions), a super-resolution water-immersion objective lens (Nikon CFI SR Plan Apo IR 60× 1.27 NA WI), a continuous wave 6 W 532 nm excitation laser (Laser Quantum Opus) coupled to the observation chamber via a custom-fabricated quartz prism (Eksma).
Nucleotide-free NTSR1–G protein complexes were prepared by incubating dye-labelled receptors with purified complexes of G protein and biotinylated Tris-Ni 2+ -NTA at a molar ratio of 5:4, in the presence of saturating NTS 8–13 , for 5 min at room temperature to promote GDP release.
The reaction mix was then incubated with Apyrase (NEB; 5 U ml −1 ) for an additional 10 min at room temperature to remove the free GDP.
The nucleotide-free complexes were then surface immobilized within (1,3) trans -divalent streptavidin 57 -coated microfluidic devices prepared by passivating quartz slides and coverslips with polyethylene glycol (PEG) and biotin–PEG followed by capping treatment with sulfo NHS acetate 58 .
All experiments were performed in imaging buffer (20 mM HEPES, pH 7.5, 100 mM NaCl, 2 mM CaCl 2 , 5 mM MgCl 2 , 0.01%LMNG/0.001% CHS), supplemented with an enzymatic oxygen scavenging system consisting of 2 mM protocatechuic acid, 50 nM protocatechuate-3,4-dioxygenase.
For NTSR1 dissociation measurements, imaging buffer with GTP (1 mM) was rapidly introduced 1 s after the start of the data acquisition, using a custom-built computer-controlled microfluidic system 58 .
All single-molecule fluorescence data were recorded in stroboscopic mode under low 532 nm laser illumination intensity (6.5 W cm −2 ), at a frame rate of 5 s − 1 , with an interval of 2 s using custom microscope control software written in LabVIEW (National Instruments) and synchronizing the microfluidic system (controlled by Cetoni Elements software) with the imaging system via TTL triggering 58 .
Fluorescent particles were counted using SPARTAN 56 .
Control experiments were performed by injecting buffer without GTP to measure the intrinsic rate of fluorophore photobleaching and spontaneous dissociation.
These data were fit to a single exponential decay function.
The rates of GTP-induced dissociation of NTS 8–13 -bound, labelled NTSR 1 from G proteins were estimated by plotting the loss of fluorescent particles over time and fitting the data to a triple exponential decay function, where one component corresponds to the intrinsic rate of photobleaching and dissociation.
The aggregated rate of dissociation was calculated by the weighted average contributions of fast ( A 1 / t 1 ) and intermediate ( A 2 / t 2 ) decay phases.
Further information on research design is available in the Nature Portfolio Reporting Summary linked to this article.
Jang, W., Lu, S., Xu, X., Wu, G.
& Lambert, N.
A.
The role of G protein conformation in receptor-G protein selectivity.
Nat.
Chem.
Biol.
19 , 687–694 (2023).
Article CAS PubMed PubMed Central Google Scholar
Casiraghi, M.
et al.
Structure and dynamics determine G protein coupling specificity at a class A GPCR.
Sci.
Adv.
11 , eadq3971 (2025).
Article ADS CAS PubMed PubMed Central Google Scholar
Lagerström, M.
C.
& Schiöth, H.
B.
Structural diversity of G protein-coupled receptors and significance for drug discovery.
Nat.
Rev.
Drug Discov.
7 , 339–357 (2008).
Milligan, G.
& Kostenis, E.
Heterotrimeric G-proteins: a short history.
Br.
J.
Pharmacol.
147 , 546–555 (2006).
Kolb, P.
et al.
Community guidelines for GPCR ligand bias: IUPHAR review 32.
Br.
J.
Pharmacol.
179 , 3651–3674 (2022).
Neto, J.
A.
et al.
Biased versus partial agonism in the search for safer opioid analgesics.
Molecules 25 , 3870 (2020).
Pándy-Szekeres, G.
et al.
GPCRdb in 2018: adding GPCR structure models and ligands.
Nucleic Acids Res.
46 , 440–446 (2017).
Okashah, N.
et al.
Variable G protein determinants of GPCR coupling selectivity.
Proc.
Natl Acad.
Sci.
USA 116 , 12054–12059 (2019).
Inoue, A.
et al.
Illuminating G-protein-coupling selectivity of GPCRs.
Cell 177 , 1933–1947 (2019).
St-Gelais, F., Jomphe, C.
& Trudeau, L.-E.
The role of neurotensin in central nervous system pathophysiology: What is the evidence?
J.
Psychiatry Neurosci.
31 , 229–245 (2006).
Article PubMed PubMed Central Google Scholar
Masuho, I.
et al.
Rules and mechanisms governing G protein coupling selectivity of GPCRs.
Cell Rep.
42 , 113173 (2023).
Kato, H.
E.
et al.
Conformational transitions of a neurotensin receptor 1–G i1 complex.
Nature 572 , 80–85 (2019).
Zhang, M.
et al.
Cryo-EM structure of an activated GPCR–G protein complex in lipid nanodiscs.
Nat.
Struct.
Mol.
Biol.
28 , 258–267 (2021).
Papasergi-Scott, M.
M.
et al.
Time-resolved cryo-EM of G-protein activation by a GPCR.
Nature 629 , 1182–1191 (2024).
Robertson, M.
J.
et al.
Non-equilibrium snapshots of ligand efficacy at the μ-opioid receptor.
Nature https://doi.org/10.1038/s41586-025-10056-4 (2025).
Punjani, A.
& Fleet, D.
J.
3D variability analysis: resolving continuous flexibility and discrete heterogeneity from single particle cryo-EM.
J.
Struct.
Biol.
213 , 107702 (2021).
Article CAS PubMed Google Scholar
Ballesteros, J.
A.
& Weinstein, H.
Integrated methods for the construction of three-dimensional models and computational probing of structure-function relations in G protein-coupled receptors.
Methods Neurosci.
25 , 366–428 (1995).
Kim, K.
et al.
Structure of a hallucinogen-activated G q -coupled 5-HT 2 A serotonin receptor.
Cell 182 , 1574–1588 (2020).
Nehmé, R.
et al.
Mini-G proteins: novel tools for studying GPCRs in their active conformation.
PLoS ONE 12 , e0175642 (2017).
Knight, K.
M.
et al.
A universal allosteric mechanism for G protein activation.
Mol.
Cell 81 , 1384–1396 (2021).
Hewitt, N.
et al.
Catalytic site mutations confer multiple states of G protein activation.
Sci.
Signal.
16 , eabq7842 (2023).
Flock, T.
et al.
Selectivity determinants of GPCR–G-protein binding.
Nature 545 , 317–322 (2017).
Jelinek, V., Mösslein, N.
& Bünemann, M.
Structures in G proteins important for subtype selective receptor binding and subsequent activation.
Commun.
Biol.
4 , 635 (2021).
Kostenis, E., Conklin, B.
R.
& Wess, J.
Molecular basis of receptor/G protein coupling selectivity studied by coexpression of wild type and mutant M2 muscarinic receptors with mutant Gα q subunits.
Biochemistry 36 , 1487–1495 (1997).
Liu, Q.
et al.
Ligand recognition and G-protein coupling selectivity of cholecystokinin A receptor.
Nat.
Chem.
Biol.
17 , 1238–1244 (2021).
Conklin, B.
R., Farfel, Z., Lustig, K.
D., Julius, D.
& Bourne, H.
R.
Substitution of three amino acids switches receptor specificity of G q α to that of G i α.
Nature 363 , 274–276 (1993).
Article ADS CAS PubMed Google Scholar
Liu, J., Conklin, B.
R., Blin, N., Yun, J.
& Wess, J.
Identification of a receptor/G-protein contact site critical for signaling specificity and G-protein activation.
Proc.
Natl Acad.
Sci.
USA 92 , 11642–11646 (1995).
Barroso, S.
et al.
Identification of residues involved in neurotensin binding and modeling of the agonist binding site in neurotensin receptor 1.
J.
Biol.
Chem.
275 , 328–336 (2000).
Henry, J.
A., Horwell, D.
C., Meecham, K.
G.
& Rees, D.
C.
A structure-affinity study of the amino acid side-chains in neurotensin: N and C terminal deletions and Ala-scan.
Bioorg.
Med.
Chem.
Lett.
3 , 949–952 (1993).
Wu, Z.
et al.
Structural basis for the ligand recognition and G protein subtype selectivity of kisspeptin receptor.
Sci.
Adv.
10 , eadn7771 (2024).
Huang, S.
et al.
GPCRs steer G i and G s selectivity via TM5–TM6 switches as revealed by structures of serotonin receptors.
Mol.
Cell.
83 , 2681–2695 (2022).
Han, J.
et al.
Ligand and G-protein selectivity in the κ-opioid receptor.
Nature 617 , 417–425 (2023).
Duan, J.
et al.
Molecular basis for allosteric agonism and G protein subtype selectivity of galanin receptors.
Nat.
Commun.
13 , 1364 (2022).
Yano, A.
et al.
An aromatic amino acid within intracellular loop 2 of the prostaglandin EP2 receptor is a prerequisite for selective association and activation of Gα s .
Biochim.
Biophys.
Acta 6 , 615–622 (2017).
Kim, H.
R.
et al.
Structural mechanism underlying primary and secondary coupling between GPCRs and the G i/o family.
Nat.
Commun.
11 , 3160 (2020).
Faouzi, A.
et al.
Structure-based design of bitopic ligands for the μ-opioid receptor.
Nature 316 , 767–774 (2023).
Elgeti, M.
& Hubbel, W.
L.
DEER analysis of GPCR conformational heterogeneity.
Biomolecules 11 , 778 (2021).
Gregorio, G.
G.
et al.
Single-molecule analysis of ligand efficacy in β 2 AR–G-protein activation.
Nature 547 , 68–73 (2017).
Latorraca, N.
R., Venkatakrishnan, A.
J.
& Dror, R.
O.
GPCR dynamics: structures in motion.
Chem.
Rev.
117 , 139–155 (2017).
Slosky, L.
M.
et al.
β-arrestin biased allosteric modulator of NTSR1 selectively attenuates addictive behaviors.
Cell 181 , 1364–1379 (2021).
Krumm, B.
E.
et al.
Neurotensin receptor allosterism revealed in complex with a biased allosteric modulator.
Biochemistry 62 , 1233–1248 (2023).
Duan, J.
et al.
GPCR activation and GRK2 assembly by a biased intracellular agonist.
Nature 620 , 676–681 (2023).
Guo, R.
et al.
Arresin-biased allosteric modulator of neurotensin receptor 1 alleviates acute and chronic pain.
Cell 188 , 4332–4349.e21 (2025).
Muhle, J.
et al.
Cyclic peptide inhibitors function as molecular glues to stabilize G q/11 heterotrimers.
Proc.
Natl Acad.
Sci.
USA 122 , e2418398122 (2025).
Punjani, A., Rubinstein, J.
L., Fleet, D.
J.
& Brubaker, M.
A.
cryoSPARC: algorithms for rapid unsupervised cryo-EM structure determination.
Nat.
Methods 14 , 290–296 (2017).
Emsley, P., Lohkamp, B., Scott, W.
G.
& Cowtan, K.
Features and development of Coot.
Acta Crystallogr.
D 66 , 486–501 (2010).
Liebschner, D.
et al.
Macromolecular structure determination using X-rays, neutrons and electrons: recent developments in Phenix.
Acta Crystallogr.
D 75 , 861–877 (2019).
Lomize, M.
A., Pogozheva, I.
D., Joo, H., Mosberg, H.
I.
& Lomize, A.
L.
OPM database and PPM web server: resources for positioning of proteins in membranes.
Nucleic Acids Res.
40 , D370–D376 (2012).
Jorgensen, W.
L., Chandrasekhar, J., Madura, J.
D., Impey, R.
W.
& Klein, M.
L.
Comparison of simple potential functions for simulating liquid water.
J.
Chem.
Phys.
79 , 926–935 (1983).
Jo, S., Kim, T., Iyer, V.
G.
& Im, W.
CHARMM-GUI: a web-based graphical user interface for CHARMM.
J.
Comput.
Chem.
29 , 1859–1865 (2008).
Phillips, J.
C.
et al.
Scalable molecular dynamics on CPU and GPU architectures with NAMD.
J.
Chem.
Phys.
153 , 044130 (2020).
Huang, J.
et al.
CHARMM6m: an improved force field for folded and intrinsically disordered proteins.
Nat.
Methods 14 , 71–73 (2017).
Klauda, J.
B.
et al.
Update of the CHARMM all-atom additive force field for lipids: validation on six lipid types.
J.
Phys.
Chem.
B 114 , 7830–7843 (2010).
Vanommeslaeghe, K.
et al.
CHARMM general force field: a force field for drug-like molecules compatible with the CHARMM all-atom additive biological force fields.
J.
Comput.
Chem.
31 , 671–690 (2010).
Humphrey, W., Dalke, A.
& Schulten, K.
VMD—Visual Molecular Dynamics.
J.
Mol.
Graphics 14 , 33–38 (1996).
Juette, M.
F.
et al.
Single-molecule imaging of non-equilibrium molecular ensembles on the millisecond timescale.
Nat.
Methods 13 , 341–344 (2016).
Fairhead, M., Krndija, D., Lowe, E.
D.
& Howarth, M.
Plug-and-play pairing via defined divalent streptavidins.
J.
Mol.
Biol.
426 , 199–214 (2014).
Kiselev, R.
et al.
Parallel stopped-flow interrogation of diverse biological systems at the single-molecule scale.
Nat.
Methods 23 , 78–87 (2025).
We acknowledge funding from NIH K99/R00 HD107581 (M.J.R.), CPRIT award RR230042 (M.J.R.), NIH DP1 DA063082 (M.J.R.), NIH GM145284 (N.A.L.) and St Jude Children’s Research Hospital Collaborative Research Consortium on G protein-coupled receptors (S.C.B.).
M.J.R.
is a CPRIT Scholar in Cancer Research.
We thank G.
P.
Yadav for cryo-EM data collection at the Laboratory for Biomolecular Structure and Dynamics (LBSD) of Texas A&M University.
The LBSD is supported, in part, by the Department of Biochemistry & Biophysics, AgriLife and the Texas A&M University.
We also thank the Single-Molecule Imaging Center at St Jude Children’s Research Hospital.
We thank A.
B.
Seven for discussions about nanodiscs; M.
M.
Papasergi-Scott for critical reading of the manuscript; and B.
Singal for cryo-EM data collection at the Stanford University Cryo-EM Center (cEMc).
Verna and Marrs McLean Department of Biochemistry and Molecular Pharmacology, Baylor College of Medicine, Houston, TX, USA
Alina A.
Vo & Michael J.
Robertson
Department of Structural Biology, St Jude Children’s Research Hospital, Memphis, TN, USA
Arnab Modak & Scott C.
Blanchard
Department of Pharmacology and Toxicology, Medical College of Georgia, Augusta University, Augusta, GA, USA
Search author on: PubMed Google Scholar
M.J.R.
conceived and supervised the project, expressed proteins, prepared complex, prepared cryo-EM grids, analysed and processed cryo-EM data, built and refined atomic models, designed and executed molecular dynamics simulations, analysed data and prepared figures.
A.M.
labelled NTSR and performed single-molecule fluorescence and data analysis under supervision of S.C.B.
A.A.V.
purified proteins and cloned constructs for biochemical assays.
M.J.R.
wrote the manuscript with input from N.A.L.
N.A.L.
designed and analysed kinetic BRET assays, which were performed by S.L.
Correspondence to Michael J.
Robertson .
S.C.B.
holds an equity interest in Lumidyne Technologies.
The other authors declare no competing interests.
Nature thanks the anonymous reviewer(s) for their contribution to the peer review of this work.
Peer review reports are available.
Publisher’s note Springer Nature remains neutral with regard to jurisdictional claims in published maps and institutional affiliations.
Extended data figures and tables
Extended Data Fig.
1 Cryo-EM data processing workflow.
a ) General processing workflow for the nucleotide-free datasets, here demonstrating Gi1.
b ) Processing workflow for the NTSR1-Gi1-GTP time resolved datasets.
c ) Processing workflow for the NTSR1-G11-GTP time resolved datasets.
d ) Processing of 6 s and 20 s NTSR1-Gi-GTP datasets separately.
Extended Data Fig.
2 Comparison of NTSR1-Gi Canonical and Non-Canonical States without GTP.
a ) Comparison of the canonical (blue, goldenrod) and non-canonical (turquoise, orange) GTP-free states (C-Open-Apo and NC-Open-Apo) aligned on NTSR1 highlighting differences in the NPxxY motif and TM7-H8 interface.
b ) Comparison of the canonical (blue) and non-canonical (turquoise) GTP-free states (C-Open-Apo and NC-Open-Apo) aligned on NTSR1 highlighting the disordering of ICL2 in the NC-Open-Apo State.
c ) Comparison of the cryo-EM maps for the Gi1 protein in the C-Open-Apo (goldenrod) and NC-Open-Apo (orange) states aligned on Gα, with red arrows highlighting differing regions.
d ) Overlay of the differing interactions between NTSR1 and the β2-β3 loop between the C-Open-Apo (blue, goldenrod) and NC-Open-Apo (turquoise, orange) GTP-free states aligned on Gα.
e ) 3DVA analysis of the C-Open-Apo and NC-Open-Apo states highlighting Linker I differences.
f ) MD simulation results for C- and NC- simulations of NTSR-Gi1-Apo starting from open and closed AHD.
Box plots depict median (center line), interquartile range (box range), while whiskers depict maximum and minimum values, determined from five independent MD simulation replicates.
Extended Data Fig.
3 Comparison of NTSR1-Gi Canonical and Non-Canonical States with GTP.
a ) Cryo-EM map for the C-Closed-GTP Gi state highlighting the partially unfolded tip of the retracted α5 helix resolved inside the intracellular receptor cavity.
b ) Alignment and comparison of the C-Open-Apo (blue, goldenrod), C-Open-GTP (cyan, brick) and C-Closed-GTP (mint, pink).
c ) Overlay of the C-Open-Apo, NC-Open-Apo, and NC-Closed-GTP aligned on NTSR1 highlighting the differing αN positions of Gi1 (goldenrod).
d ) Pie charts of the percent of NTSR1-G-protein contacts attributed to each NTSR1 region in the C-Open-Apo, NC-Open-Apo, C-Closed-GTP, and NC-Closed-GTP states.
e ) Difference plots in the percent of NTSR1-G-protein contacts from Open-Apo to Closed-GTP states for the C and NC conformations.
f ) Interactions in the NC-Closed-GTP state between the receptor ICL2 (turquoise), Gα (goldenrod) and Gβ (grey).
g ) Map and model for the NC-Closed-GTP around ICL3.
h ) Map and model comparisons for NC-Closed-GTP 3DVA states.
Extended Data Fig.
4 Comparison of NTSR1-Gi-GTP in Detergent and Nanodisc.
a ) 2D Class averages of the four resolved states of the NTSR1-Gi1-GTP complex with the relative populations in detergent and MSP1D1 nanodisc.
b ) Maps of the MSP1D1 canonical GTP states with the detergent models rigid body docked in highlighting the virtually identical structures.
Extended Data Fig.
5 Comparison of NTSR1-Gi and NTSR1-G11 Linker 1 Regions.
a ) Cryo-EM maps and models for the α1 helix of the three nucleotide-free NTSR1-G11 baseline structures resolved.
b ) Sequences of the α1-linker I-αA region for Gi1 and G11 highlighting the E- > G substitution in linker I.
c ) Kinetic BRET assays examining the influence of the Linker 1 region on Gi1 and Gq signaling, including diagram of the assay setup (top) and which residues are swapped (bottom).
Experiments were performed with 3 independent experiments with 4 technical replicates each.
Extended Data Fig.
6 Comparison of NTSR1-Gi and NTSR1-G11 Complexes & Intermediate States.
a ) Alignment of the Gα subunits of the Gi C-Open-Apo, Gi C-Closed*-GTP, G11 C-Closed-GTP, and G11 C-Closed*-GTP states, with insets highlighting the switch II and switch III regions of differing pairs.
b ) Alignment of the Gα subunits of the NTSR1-Gi1 C-Open-Apo and NTSR1-Gi1 C-Closed*-GTP states.
c ) Alignment of the Gi-C-Open-Apo, Gi-C-Closed*-GTP, and G11 C-Closed*-GTP states.
d ) Alignment of the Gi-C-Closed-GTP and G11-C-Closed-GTP states.
e ) Percent of NTSR1-G-protein contacts attributable to each region of NTSR1 in the C-Open-Apo and C-Closed-GTP states.
f ) Difference in percent of contacts from the G11-C-Open-Apo and G11-C-Closed-GTP states for NTSR1.
g ) Alignment of the sequences of the αN-β1 loop, β2-β3 loop, and α5 loop of Gi1 and G11.
h ) Alignment of the sequences of the αN-β1 loop, β2-β3 loop, and α5 loop of various Gi/o, Gq/11 family members, and Gs.
Extended Data Fig.
7 Comparison of Gi versus Gq-Selective Residues in Intermediate Complexes.
a ) Alignment of the NC-Open-Apo structures of NTSR1-Gi1 (goldenrod G-protein) and NTSR1-G11 (coral pink G-protein) on the αN helix/RHD.
b ) Unsharpened map and model for the Gi NC-Open-Apo (left) and G11 NC-Open-Apo (right) states in the TM1-ICL1-TM2 region.
c ) Unsharpened map and model for the Gi NC-Open-Apo state showing the H8 region.
d ) C-Closed-GTP NTSR1-Gi1 complex showing the probable R294-D350 salt bridge.
e ) Alignment of C-Closed-GTP NTSR1-Gi1 (dark blue receptor, goldenrod G-protein) and NTSR1-G11 (Cyan receptor, coral pink G-protein) on the αN helix/RHD with the ~5 Å shift in TM6 R294 labeled.
f ) Map and model for the Gi C-Closed-GTP state showing the TM6-α5 interface.
g ) Unsharpened map and model for the Gi C-Closed-GTP (left) and Gi NC-Closed-GTP (right) states in the TM1-ICL1-TM2 region.
Extended Data Fig.
8 Comparison of the G-protein Signaling of MOR and NTSR1.
a ) Major structures observed in the GTP-induced activation of MOR-Gi and NTSR1-Gi in the presence of full/super agonist.
b ) Structure of the G-ACT-3 intermediate state of the MOR-GI-GTP complex with a stable, inactive-like receptor (PDB: 9ODL ).
c ) Comparison of ICL2 interactions with the β2-β3 loop and α1 helix comparing MOR-Gi-nucleotide free and MOR-Gi-GTP in an AHD domain open state (left) and comparing NTSR-Gi with MOR-Gi in the nucleotide free state (right).
d ) Comparison of the ICL2 region of MOR-Gi and NTSR1-Gi in their canonical nucleotide free states.
e ) Traces of ICL2-β2-β3 loop distances from MD simulations of the NTSR-Gi C-Closed-GTP state (top) and the same complex with MOR substituted (bottom); lines represent distances in the cryoEM structures of the C-Closed-GTP and NC-Closed-GTP complexes.
f ) Kinetic BRET traces for the MOR constructs tested in this work signaling through Gq.
Experiments were performed with 4 independent experiments with 4 technical replicates each.
g ) Amino acid frequency plots for Family A GPCR ICL2 regions grouped on primary G-protein.
Extended Data Fig.
9 CryoEM Map Validation.
a ) FSC Curves and Euler angle distribution plots for all cryoEM maps determined for this work.
Extended Data Fig.
10 Local Resolution Plots.
a ) Local resolution plots for the maps from this work.
Extended Data Table 1 Cryo-EM Map & Model Statistics, G i1 Data Full size table
Extended Data Table 2 Cryo-EM Map & Model Statistics, G 11 Data Full size table
Supplementary Information (download PDF )
Supplementary Figs.
1 and 2 and Supplementary Tables 1 and 2.
Reporting Summary (download PDF )
Supplementary Video 1 (download MP4 )
3DVA maps derived from NTSR1–G i C-closed-GTP particle stack.
Supplementary Video 2 (download MP4 )
3DVA maps derived from NTSR1–G i NC-closed-GTP particle stack.
Supplementary Video 3 (download MP4 )
3DVA maps derived from NTSR1–G 11 C-closed-GTP particle stack.
Peer Review File (download PDF )
Version of record : 11 March 2026
DOI : https://doi.org/10.1038/s41586-026-10120-7
Related Stories


Source: This article was originally published by Nature News
Read Full Original Article →
Comments (0)
No comments yet. Be the first to comment!
Leave a Comment